Immigrants from Switzerland vs Immigrants from Lithuania 2 or more Vehicles in Household

COMPARE

Immigrants from Switzerland
Race
Ancestry
AfghanAfricanAlaska NativeAlaskan AthabascanAlbanianAleutAlsatianAmericanApacheArabArapahoArgentineanArmenianAssyrian/Chaldean/SyriacAustralianAustrianBahamianBangladeshiBarbadianBasqueBelgianBelizeanBermudanBhutaneseBlackfeetBolivianBrazilianBritishBritish West IndianBulgarianBurmeseCajunCambodianCanadianCape VerdeanCarpatho RusynCelticCentral AmericanCentral American IndianCherokeeCheyenneChickasawChileanChineseChippewaChoctawColombianColvilleComancheCosta RicanCreeCreekCroatianCrowCubanCypriotCzechCzechoslovakianDanishDelawareDominicanDutchDutch West IndianEastern EuropeanEcuadorianEgyptianEnglishEstonianEthiopianEuropeanFijianFilipinoFinnishFrenchFrench American IndianFrench CanadianGermanGerman RussianGhanaianGreekGuamanian/ChamorroGuatemalanGuyaneseHaitianHmongHonduranHopiHoumaHungarianIcelanderIndian (Asian)IndonesianInupiatIranianIraqiIrishIroquoisIsraeliItalianJamaicanJapaneseJordanianKenyanKiowaKoreanLaotianLatvianLebaneseLiberianLithuanianLumbeeLuxembourgerMacedonianMalaysianMalteseMarshalleseMenomineeMexicanMexican American IndianMongolianMoroccanNative HawaiianNavajoNepaleseNew ZealanderNicaraguanNigerianNorthern EuropeanNorwegianOkinawanOsageOttawaPaiutePakistaniPalestinianPanamanianParaguayanPennsylvania GermanPeruvianPimaPolishPortuguesePotawatomiPuebloPuerto RicanPuget Sound SalishRomanianRussianSalvadoranSamoanScandinavianScotch-IrishScottishSeminoleSenegaleseSerbianShoshoneSierra LeoneanSiouxSlavicSlovakSloveneSomaliSouth AfricanSouth AmericanSouth American IndianSoviet UnionSpaniardSpanishSpanish AmericanSpanish American IndianSri LankanSubsaharan AfricanSudaneseSwedishSwissSyrianTaiwaneseThaiTlingit-HaidaTohono O'OdhamTonganTrinidadian and TobagonianTsimshianTurkishU.S. Virgin IslanderUgandanUkrainianUruguayanUteVenezuelanVietnameseWelshWest IndianYakamaYaquiYugoslavianYumanYup'ikZimbabwean
Immigration
NonimmigrantsImmigrantsAfghanistanAfricaAlbaniaArgentinaArmeniaAsiaAustraliaAustriaBahamasBangladeshBarbadosBelarusBelgiumBelizeBoliviaBosnia and HerzegovinaBrazilBulgariaBurma/MyanmarCabo VerdeCambodiaCameroonCanadaCaribbeanCentral AmericaChileChinaColombiaCongoCosta RicaCroatiaCubaCzechoslovakiaDenmarkDominicaDominican RepublicEastern AfricaEastern AsiaEastern EuropeEcuadorEgyptEl SalvadorEnglandEritreaEthiopiaEuropeFijiFranceGermanyGhanaGreeceGrenadaGuatemalaGuyanaHaitiHondurasHong KongHungaryIndiaIndonesiaIranIraqIrelandIsraelItalyJamaicaJapanJordanKazakhstanKenyaKoreaKuwaitLaosLatin AmericaLatviaLebanonLiberiaMalaysiaMexicoMicronesiaMiddle AfricaMoldovaMoroccoNepalNetherlandsNicaraguaNigeriaNorth AmericaNorth MacedoniaNorthern AfricaNorthern EuropeNorwayOceaniaPakistanPanamaPeruPhilippinesPolandPortugalRomaniaRussiaSaudi ArabiaScotlandSenegalSerbiaSierra LeoneSingaporeSomaliaSouth AfricaSouth AmericaSouth Central AsiaSouth Eastern AsiaSouthern EuropeSpainSri LankaSt. Vincent and the GrenadinesSudanSwedenSwitzerlandSyriaTaiwanThailandTrinidad and TobagoTurkeyUgandaUkraineUruguayUzbekistanVenezuelaVietnamWest IndiesWestern AfricaWestern AsiaWestern EuropeYemenZaireZimbabweAzores
Immigrants from Lithuania
Race
Ancestry
AfghanAfricanAlaska NativeAlaskan AthabascanAlbanianAleutAlsatianAmericanApacheArabArapahoArgentineanArmenianAssyrian/Chaldean/SyriacAustralianAustrianBahamianBangladeshiBarbadianBasqueBelgianBelizeanBermudanBhutaneseBlackfeetBolivianBrazilianBritishBritish West IndianBulgarianBurmeseCajunCambodianCanadianCape VerdeanCarpatho RusynCelticCentral AmericanCentral American IndianCherokeeCheyenneChickasawChileanChineseChippewaChoctawColombianColvilleComancheCosta RicanCreeCreekCroatianCrowCubanCypriotCzechCzechoslovakianDanishDelawareDominicanDutchDutch West IndianEastern EuropeanEcuadorianEgyptianEnglishEstonianEthiopianEuropeanFijianFilipinoFinnishFrenchFrench American IndianFrench CanadianGermanGerman RussianGhanaianGreekGuamanian/ChamorroGuatemalanGuyaneseHaitianHmongHonduranHopiHoumaHungarianIcelanderIndian (Asian)IndonesianInupiatIranianIraqiIrishIroquoisIsraeliItalianJamaicanJapaneseJordanianKenyanKiowaKoreanLaotianLatvianLebaneseLiberianLithuanianLumbeeLuxembourgerMacedonianMalaysianMalteseMarshalleseMenomineeMexicanMexican American IndianMongolianMoroccanNative HawaiianNavajoNepaleseNew ZealanderNicaraguanNigerianNorthern EuropeanNorwegianOkinawanOsageOttawaPaiutePakistaniPalestinianPanamanianParaguayanPennsylvania GermanPeruvianPimaPolishPortuguesePotawatomiPuebloPuerto RicanPuget Sound SalishRomanianRussianSalvadoranSamoanScandinavianScotch-IrishScottishSeminoleSenegaleseSerbianShoshoneSierra LeoneanSiouxSlavicSlovakSloveneSomaliSouth AfricanSouth AmericanSouth American IndianSoviet UnionSpaniardSpanishSpanish AmericanSpanish American IndianSri LankanSubsaharan AfricanSudaneseSwedishSwissSyrianTaiwaneseThaiTlingit-HaidaTohono O'OdhamTonganTrinidadian and TobagonianTsimshianTurkishU.S. Virgin IslanderUgandanUkrainianUruguayanUteVenezuelanVietnameseWelshWest IndianYakamaYaquiYugoslavianYumanYup'ikZimbabwean
Immigration
NonimmigrantsImmigrantsAfghanistanAfricaAlbaniaArgentinaArmeniaAsiaAustraliaAustriaBahamasBangladeshBarbadosBelarusBelgiumBelizeBoliviaBosnia and HerzegovinaBrazilBulgariaBurma/MyanmarCabo VerdeCambodiaCameroonCanadaCaribbeanCentral AmericaChileChinaColombiaCongoCosta RicaCroatiaCubaCzechoslovakiaDenmarkDominicaDominican RepublicEastern AfricaEastern AsiaEastern EuropeEcuadorEgyptEl SalvadorEnglandEritreaEthiopiaEuropeFijiFranceGermanyGhanaGreeceGrenadaGuatemalaGuyanaHaitiHondurasHong KongHungaryIndiaIndonesiaIranIraqIrelandIsraelItalyJamaicaJapanJordanKazakhstanKenyaKoreaKuwaitLaosLatin AmericaLatviaLebanonLiberiaLithuaniaMalaysiaMexicoMicronesiaMiddle AfricaMoldovaMoroccoNepalNetherlandsNicaraguaNigeriaNorth AmericaNorth MacedoniaNorthern AfricaNorthern EuropeNorwayOceaniaPakistanPanamaPeruPhilippinesPolandPortugalRomaniaRussiaSaudi ArabiaScotlandSenegalSerbiaSierra LeoneSingaporeSomaliaSouth AfricaSouth AmericaSouth Central AsiaSouth Eastern AsiaSouthern EuropeSpainSri LankaSt. Vincent and the GrenadinesSudanSwedenSyriaTaiwanThailandTrinidad and TobagoTurkeyUgandaUkraineUruguayUzbekistanVenezuelaVietnamWest IndiesWestern AfricaWestern AsiaWestern EuropeYemenZaireZimbabweAzores
2 or more Vehicles in Household
Income
Poverty
Unemployment
Labor Participation
Family Structure
Vehicle Availability
Education Level
Disability

2 or more Vehicles in Household Comparison

Immigrants from Switzerland

Immigrants from Lithuania

Tragic
Good
53.4%
2 OR MORE VEHICLES IN HOUSEHOLD
3.0/ 100
METRIC RATING
234th/ 347
METRIC RANK
55.8%
2 OR MORE VEHICLES IN HOUSEHOLD
70.4/ 100
METRIC RATING
156th/ 347
METRIC RANK

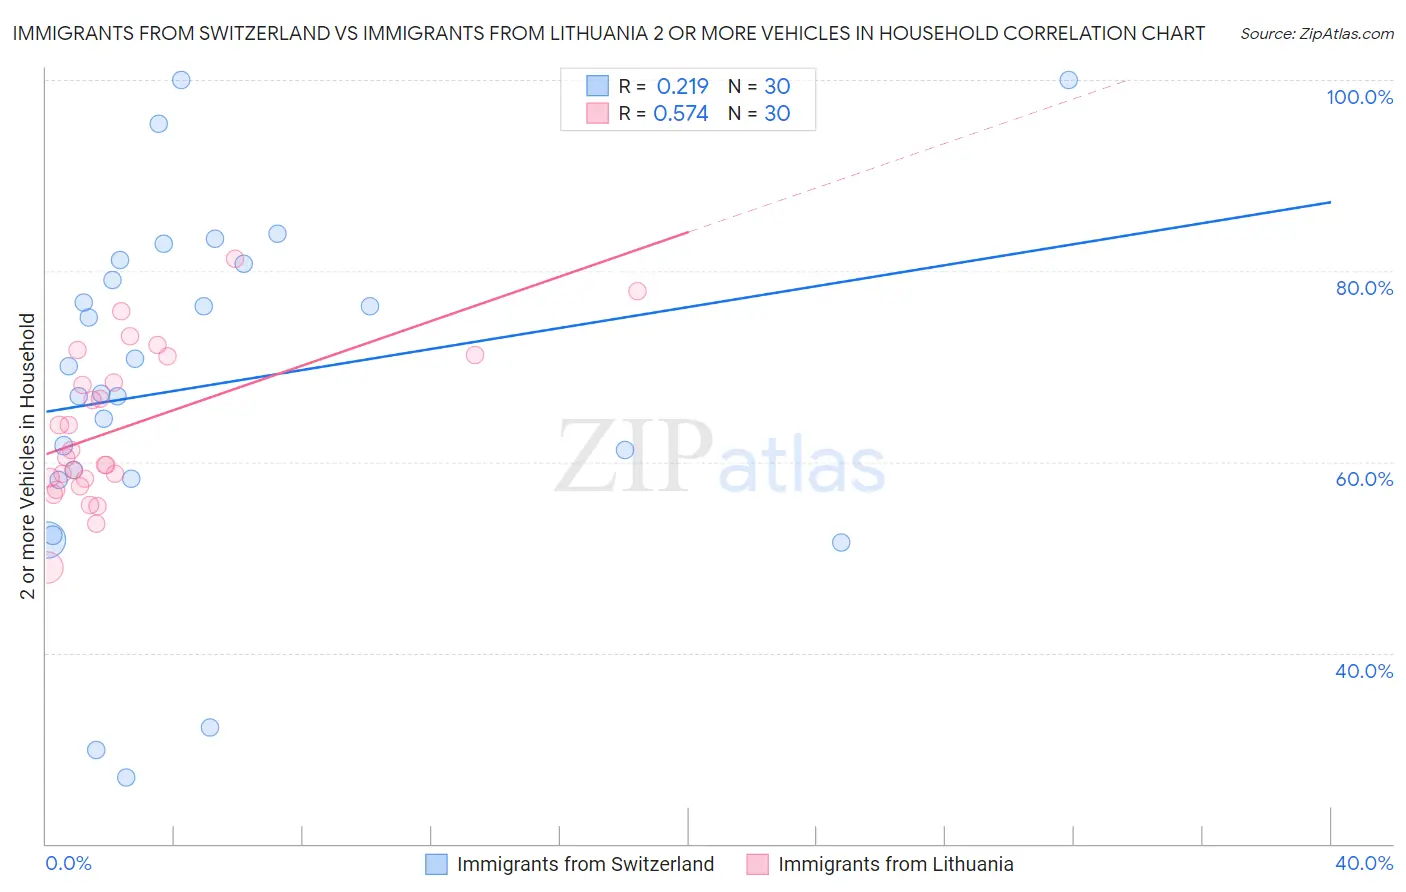
Immigrants from Switzerland vs Immigrants from Lithuania 2 or more Vehicles in Household Correlation Chart

The statistical analysis conducted on geographies consisting of 148,072,536 people shows a weak positive correlation between the proportion of Immigrants from Switzerland and percentage of households with 2 or more vehicles available in the United States with a correlation coefficient (R) of 0.219 and weighted average of 53.4%. Similarly, the statistical analysis conducted on geographies consisting of 117,713,976 people shows a substantial positive correlation between the proportion of Immigrants from Lithuania and percentage of households with 2 or more vehicles available in the United States with a correlation coefficient (R) of 0.574 and weighted average of 55.8%, a difference of 4.5%.
Immigrants from Switzerland vs Immigrants from Lithuania 2 or more Vehicles in Household

2 or more Vehicles in Household Correlation Summary

MeasurementImmigrants from SwitzerlandImmigrants from Lithuania
Minimum27.0%49.0%
Maximum100.0%81.2%
Range73.0%32.3%
Mean68.0%63.7%
Median68.6%60.9%
Interquartile 25% (IQ1)58.2%58.2%
Interquartile 75% (IQ3)80.7%71.1%
Interquartile Range (IQR)22.5%12.9%
Standard Deviation (Sample)18.4%7.9%
Standard Deviation (Population)18.1%7.8%

Similar Demographics by 2 or more Vehicles in Household

Demographics Similar to Immigrants from Switzerland by 2 or more Vehicles in Household

In terms of 2 or more vehicles in household, the demographic groups most similar to Immigrants from Switzerland are Immigrants from Middle Africa (53.4%, a difference of 0.030%), Immigrants from Guatemala (53.5%, a difference of 0.060%), Ugandan (53.5%, a difference of 0.060%), Panamanian (53.5%, a difference of 0.13%), and Indonesian (53.4%, a difference of 0.13%).
DemographicsRating | Rank2 or more Vehicles in Household
Sudanese
4.1
/100
|
#227
Tragic
53.6%
Alaska Natives
3.9
/100
|
#228
Tragic
53.6%
Immigrants | Turkey
3.8
/100
|
#229
Tragic
53.6%
Immigrants | Nepal
3.6
/100
|
#230
Tragic
53.5%
Panamanians
3.4
/100
|
#231
Tragic
53.5%
Immigrants | Guatemala
3.2
/100
|
#232
Tragic
53.5%
Ugandans
3.2
/100
|
#233
Tragic
53.5%
Immigrants | Switzerland
3.0
/100
|
#234
Tragic
53.4%
Immigrants | Middle Africa
3.0
/100
|
#235
Tragic
53.4%
Indonesians
2.7
/100
|
#236
Tragic
53.4%
Macedonians
2.4
/100
|
#237
Tragic
53.3%
Immigrants | Armenia
2.3
/100
|
#238
Tragic
53.3%
Cambodians
2.3
/100
|
#239
Tragic
53.3%
Immigrants | Europe
2.1
/100
|
#240
Tragic
53.2%
Immigrants | Sierra Leone
2.1
/100
|
#241
Tragic
53.2%

Demographics Similar to Immigrants from Lithuania by 2 or more Vehicles in Household

In terms of 2 or more vehicles in household, the demographic groups most similar to Immigrants from Lithuania are Immigrants from Venezuela (55.8%, a difference of 0.010%), Immigrants from Kuwait (55.8%, a difference of 0.010%), Ukrainian (55.8%, a difference of 0.020%), Lumbee (55.9%, a difference of 0.070%), and Tlingit-Haida (55.8%, a difference of 0.090%).
DemographicsRating | Rank2 or more Vehicles in Household
Chileans
80.2
/100
|
#149
Excellent
56.1%
Nicaraguans
79.9
/100
|
#150
Good
56.1%
Immigrants | Northern Europe
78.7
/100
|
#151
Good
56.1%
Immigrants | Pakistan
78.1
/100
|
#152
Good
56.1%
Lumbee
71.9
/100
|
#153
Good
55.9%
Ukrainians
70.8
/100
|
#154
Good
55.8%
Immigrants | Venezuela
70.7
/100
|
#155
Good
55.8%
Immigrants | Lithuania
70.4
/100
|
#156
Good
55.8%
Immigrants | Kuwait
70.2
/100
|
#157
Good
55.8%
Tlingit-Haida
68.5
/100
|
#158
Good
55.8%
Paiute
68.0
/100
|
#159
Good
55.8%
Crow
67.0
/100
|
#160
Good
55.7%
Colville
61.1
/100
|
#161
Good
55.6%
German Russians
60.9
/100
|
#162
Good
55.6%
Immigrants | Zimbabwe
60.2
/100
|
#163
Good
55.6%