Immigrants from Switzerland vs Cape Verdean 2 or more Vehicles in Household
COMPARE
Immigrants from Switzerland
Cape Verdean
2 or more Vehicles in Household
2 or more Vehicles in Household Comparison
Immigrants from Switzerland
Cape Verdeans
53.4%
2 OR MORE VEHICLES IN HOUSEHOLD
3.0/ 100
METRIC RATING
234th/ 347
METRIC RANK
46.8%
2 OR MORE VEHICLES IN HOUSEHOLD
0.0/ 100
METRIC RATING
316th/ 347
METRIC RANK
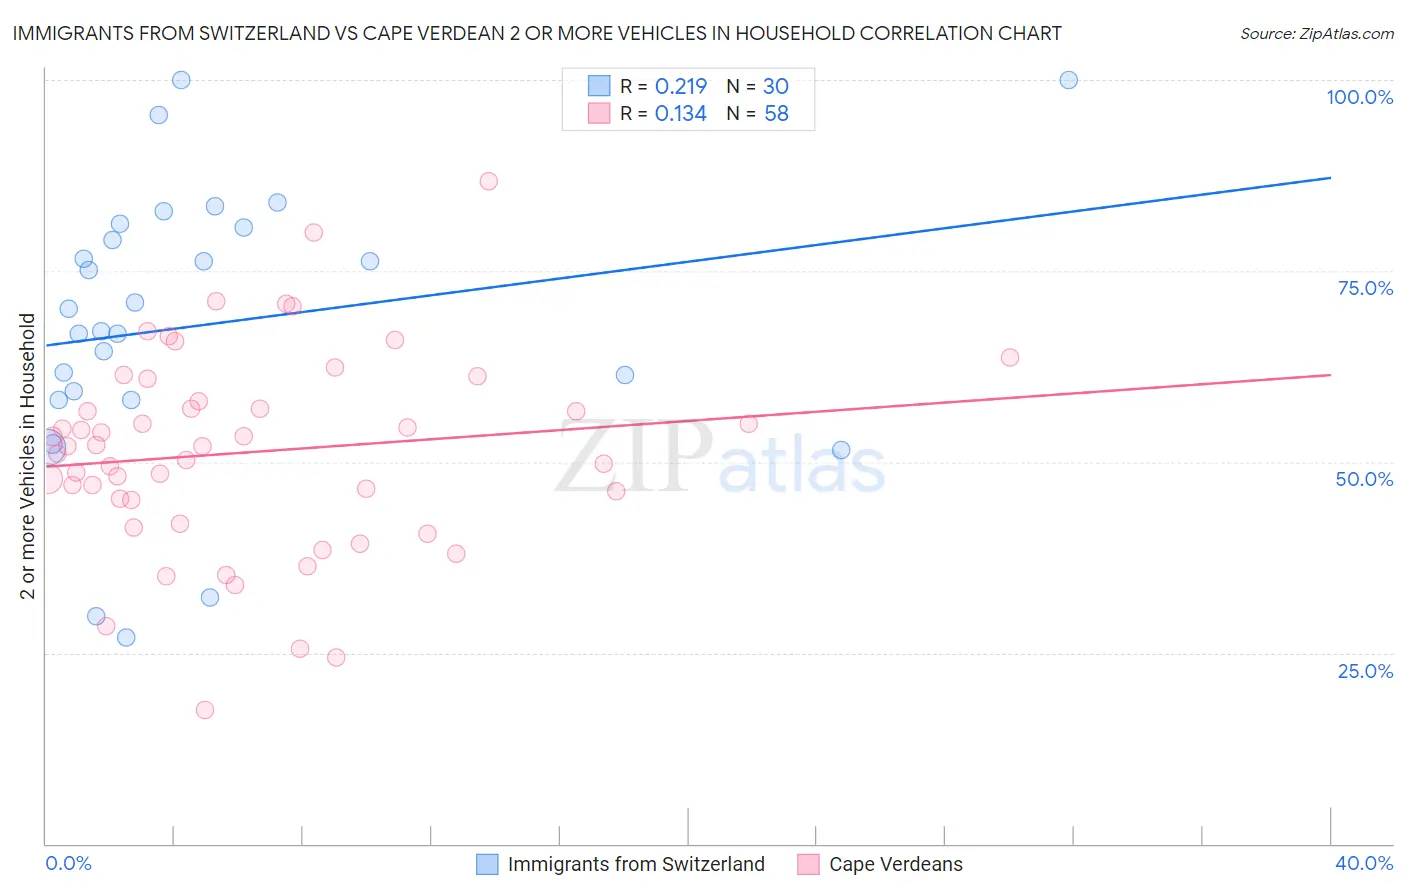
Immigrants from Switzerland vs Cape Verdean 2 or more Vehicles in Household Correlation Chart
The statistical analysis conducted on geographies consisting of 148,072,536 people shows a weak positive correlation between the proportion of Immigrants from Switzerland and percentage of households with 2 or more vehicles available in the United States with a correlation coefficient (R) of 0.219 and weighted average of 53.4%. Similarly, the statistical analysis conducted on geographies consisting of 107,560,246 people shows a poor positive correlation between the proportion of Cape Verdeans and percentage of households with 2 or more vehicles available in the United States with a correlation coefficient (R) of 0.134 and weighted average of 46.8%, a difference of 14.2%.
2 or more Vehicles in Household Correlation Summary
| Measurement | Immigrants from Switzerland | Cape Verdean |
| Minimum | 27.0% | 17.5% |
| Maximum | 100.0% | 86.7% |
| Range | 73.0% | 69.1% |
| Mean | 68.0% | 51.3% |
| Median | 68.6% | 52.1% |
| Interquartile 25% (IQ1) | 58.2% | 45.1% |
| Interquartile 75% (IQ3) | 80.7% | 58.0% |
| Interquartile Range (IQR) | 22.5% | 12.9% |
| Standard Deviation (Sample) | 18.4% | 13.3% |
| Standard Deviation (Population) | 18.1% | 13.1% |
Similar Demographics by 2 or more Vehicles in Household
Demographics Similar to Immigrants from Switzerland by 2 or more Vehicles in Household
In terms of 2 or more vehicles in household, the demographic groups most similar to Immigrants from Switzerland are Immigrants from Middle Africa (53.4%, a difference of 0.030%), Immigrants from Guatemala (53.5%, a difference of 0.060%), Ugandan (53.5%, a difference of 0.060%), Panamanian (53.5%, a difference of 0.13%), and Indonesian (53.4%, a difference of 0.13%).
| Demographics | Rating | Rank | 2 or more Vehicles in Household |
| Sudanese | 4.1 /100 | #227 | Tragic 53.6% |
| Alaska Natives | 3.9 /100 | #228 | Tragic 53.6% |
| Immigrants | Turkey | 3.8 /100 | #229 | Tragic 53.6% |
| Immigrants | Nepal | 3.6 /100 | #230 | Tragic 53.5% |
| Panamanians | 3.4 /100 | #231 | Tragic 53.5% |
| Immigrants | Guatemala | 3.2 /100 | #232 | Tragic 53.5% |
| Ugandans | 3.2 /100 | #233 | Tragic 53.5% |
| Immigrants | Switzerland | 3.0 /100 | #234 | Tragic 53.4% |
| Immigrants | Middle Africa | 3.0 /100 | #235 | Tragic 53.4% |
| Indonesians | 2.7 /100 | #236 | Tragic 53.4% |
| Macedonians | 2.4 /100 | #237 | Tragic 53.3% |
| Immigrants | Armenia | 2.3 /100 | #238 | Tragic 53.3% |
| Cambodians | 2.3 /100 | #239 | Tragic 53.3% |
| Immigrants | Europe | 2.1 /100 | #240 | Tragic 53.2% |
| Immigrants | Sierra Leone | 2.1 /100 | #241 | Tragic 53.2% |
Demographics Similar to Cape Verdeans by 2 or more Vehicles in Household
In terms of 2 or more vehicles in household, the demographic groups most similar to Cape Verdeans are Immigrants from Haiti (46.5%, a difference of 0.53%), Puerto Rican (47.1%, a difference of 0.69%), Immigrants from Ghana (47.4%, a difference of 1.3%), U.S. Virgin Islander (47.5%, a difference of 1.5%), and Haitian (47.6%, a difference of 1.7%).
| Demographics | Rating | Rank | 2 or more Vehicles in Household |
| Moroccans | 0.0 /100 | #309 | Tragic 48.8% |
| Ghanaians | 0.0 /100 | #310 | Tragic 48.0% |
| Immigrants | Belarus | 0.0 /100 | #311 | Tragic 47.9% |
| Haitians | 0.0 /100 | #312 | Tragic 47.6% |
| U.S. Virgin Islanders | 0.0 /100 | #313 | Tragic 47.5% |
| Immigrants | Ghana | 0.0 /100 | #314 | Tragic 47.4% |
| Puerto Ricans | 0.0 /100 | #315 | Tragic 47.1% |
| Cape Verdeans | 0.0 /100 | #316 | Tragic 46.8% |
| Immigrants | Haiti | 0.0 /100 | #317 | Tragic 46.5% |
| Immigrants | Albania | 0.0 /100 | #318 | Tragic 46.0% |
| Jamaicans | 0.0 /100 | #319 | Tragic 45.8% |
| Soviet Union | 0.0 /100 | #320 | Tragic 45.7% |
| Immigrants | Jamaica | 0.0 /100 | #321 | Tragic 44.5% |
| Senegalese | 0.0 /100 | #322 | Tragic 44.2% |
| Immigrants | Caribbean | 0.0 /100 | #323 | Tragic 44.2% |