Immigrants from South Central Asia vs Immigrants from Lithuania 2 or more Vehicles in Household
COMPARE
Immigrants from South Central Asia
Immigrants from Lithuania
2 or more Vehicles in Household
2 or more Vehicles in Household Comparison
Immigrants from South Central Asia
Immigrants from Lithuania
56.6%
2 OR MORE VEHICLES IN HOUSEHOLD
90.5/ 100
METRIC RATING
128th/ 347
METRIC RANK
55.8%
2 OR MORE VEHICLES IN HOUSEHOLD
70.4/ 100
METRIC RATING
156th/ 347
METRIC RANK
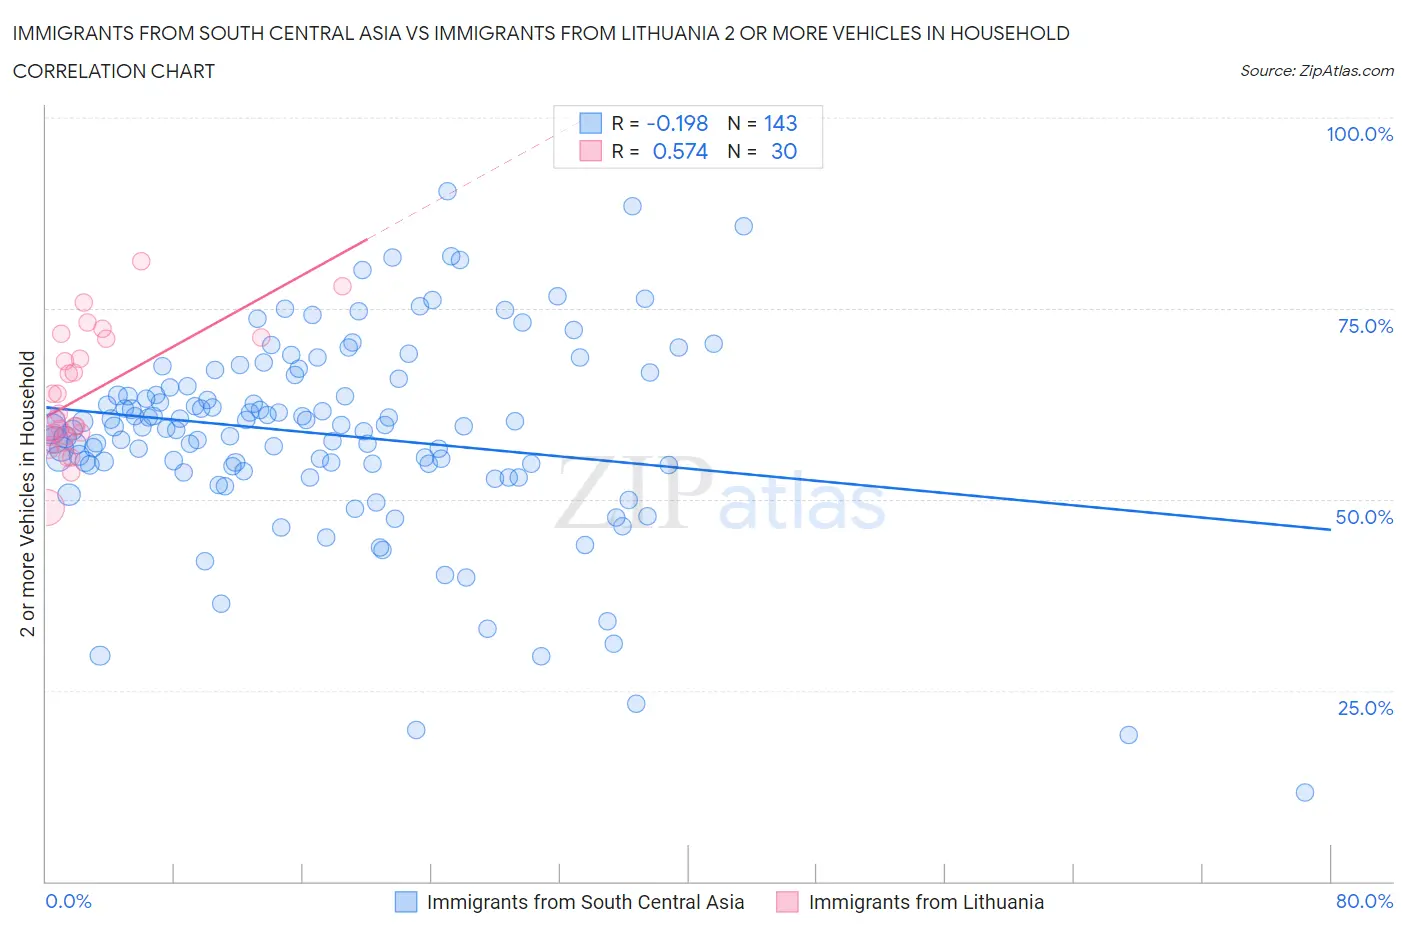
Immigrants from South Central Asia vs Immigrants from Lithuania 2 or more Vehicles in Household Correlation Chart
The statistical analysis conducted on geographies consisting of 472,708,525 people shows a poor negative correlation between the proportion of Immigrants from South Central Asia and percentage of households with 2 or more vehicles available in the United States with a correlation coefficient (R) of -0.198 and weighted average of 56.6%. Similarly, the statistical analysis conducted on geographies consisting of 117,713,976 people shows a substantial positive correlation between the proportion of Immigrants from Lithuania and percentage of households with 2 or more vehicles available in the United States with a correlation coefficient (R) of 0.574 and weighted average of 55.8%, a difference of 1.4%.
2 or more Vehicles in Household Correlation Summary
| Measurement | Immigrants from South Central Asia | Immigrants from Lithuania |
| Minimum | 11.6% | 49.0% |
| Maximum | 90.3% | 81.2% |
| Range | 78.7% | 32.3% |
| Mean | 58.5% | 63.7% |
| Median | 59.5% | 60.9% |
| Interquartile 25% (IQ1) | 54.4% | 58.2% |
| Interquartile 75% (IQ3) | 64.8% | 71.1% |
| Interquartile Range (IQR) | 10.4% | 12.9% |
| Standard Deviation (Sample) | 12.9% | 7.9% |
| Standard Deviation (Population) | 12.9% | 7.8% |
Similar Demographics by 2 or more Vehicles in Household
Demographics Similar to Immigrants from South Central Asia by 2 or more Vehicles in Household
In terms of 2 or more vehicles in household, the demographic groups most similar to Immigrants from South Central Asia are Immigrants from Thailand (56.6%, a difference of 0.020%), Ute (56.6%, a difference of 0.020%), Estonian (56.6%, a difference of 0.050%), Yugoslavian (56.6%, a difference of 0.060%), and Bulgarian (56.5%, a difference of 0.080%).
| Demographics | Rating | Rank | 2 or more Vehicles in Household |
| Sioux | 93.8 /100 | #121 | Exceptional 56.8% |
| Immigrants | South Africa | 92.5 /100 | #122 | Exceptional 56.7% |
| Australians | 91.8 /100 | #123 | Exceptional 56.7% |
| New Zealanders | 91.8 /100 | #124 | Exceptional 56.7% |
| Tsimshian | 91.6 /100 | #125 | Exceptional 56.7% |
| Estonians | 90.9 /100 | #126 | Exceptional 56.6% |
| Immigrants | Thailand | 90.7 /100 | #127 | Exceptional 56.6% |
| Immigrants | South Central Asia | 90.5 /100 | #128 | Exceptional 56.6% |
| Ute | 90.4 /100 | #129 | Exceptional 56.6% |
| Yugoslavians | 90.0 /100 | #130 | Exceptional 56.6% |
| Bulgarians | 89.7 /100 | #131 | Excellent 56.5% |
| Hungarians | 89.1 /100 | #132 | Excellent 56.5% |
| Comanche | 88.4 /100 | #133 | Excellent 56.5% |
| Immigrants | Azores | 86.6 /100 | #134 | Excellent 56.4% |
| Blackfeet | 86.5 /100 | #135 | Excellent 56.4% |
Demographics Similar to Immigrants from Lithuania by 2 or more Vehicles in Household
In terms of 2 or more vehicles in household, the demographic groups most similar to Immigrants from Lithuania are Immigrants from Venezuela (55.8%, a difference of 0.010%), Immigrants from Kuwait (55.8%, a difference of 0.010%), Ukrainian (55.8%, a difference of 0.020%), Lumbee (55.9%, a difference of 0.070%), and Tlingit-Haida (55.8%, a difference of 0.090%).
| Demographics | Rating | Rank | 2 or more Vehicles in Household |
| Chileans | 80.2 /100 | #149 | Excellent 56.1% |
| Nicaraguans | 79.9 /100 | #150 | Good 56.1% |
| Immigrants | Northern Europe | 78.7 /100 | #151 | Good 56.1% |
| Immigrants | Pakistan | 78.1 /100 | #152 | Good 56.1% |
| Lumbee | 71.9 /100 | #153 | Good 55.9% |
| Ukrainians | 70.8 /100 | #154 | Good 55.8% |
| Immigrants | Venezuela | 70.7 /100 | #155 | Good 55.8% |
| Immigrants | Lithuania | 70.4 /100 | #156 | Good 55.8% |
| Immigrants | Kuwait | 70.2 /100 | #157 | Good 55.8% |
| Tlingit-Haida | 68.5 /100 | #158 | Good 55.8% |
| Paiute | 68.0 /100 | #159 | Good 55.8% |
| Crow | 67.0 /100 | #160 | Good 55.7% |
| Colville | 61.1 /100 | #161 | Good 55.6% |
| German Russians | 60.9 /100 | #162 | Good 55.6% |
| Immigrants | Zimbabwe | 60.2 /100 | #163 | Good 55.6% |