French vs Immigrants from Lithuania 2 or more Vehicles in Household
COMPARE
French
Immigrants from Lithuania
2 or more Vehicles in Household
2 or more Vehicles in Household Comparison
French
Immigrants from Lithuania
59.8%
2 OR MORE VEHICLES IN HOUSEHOLD
100.0/ 100
METRIC RATING
44th/ 347
METRIC RANK
55.8%
2 OR MORE VEHICLES IN HOUSEHOLD
70.4/ 100
METRIC RATING
156th/ 347
METRIC RANK
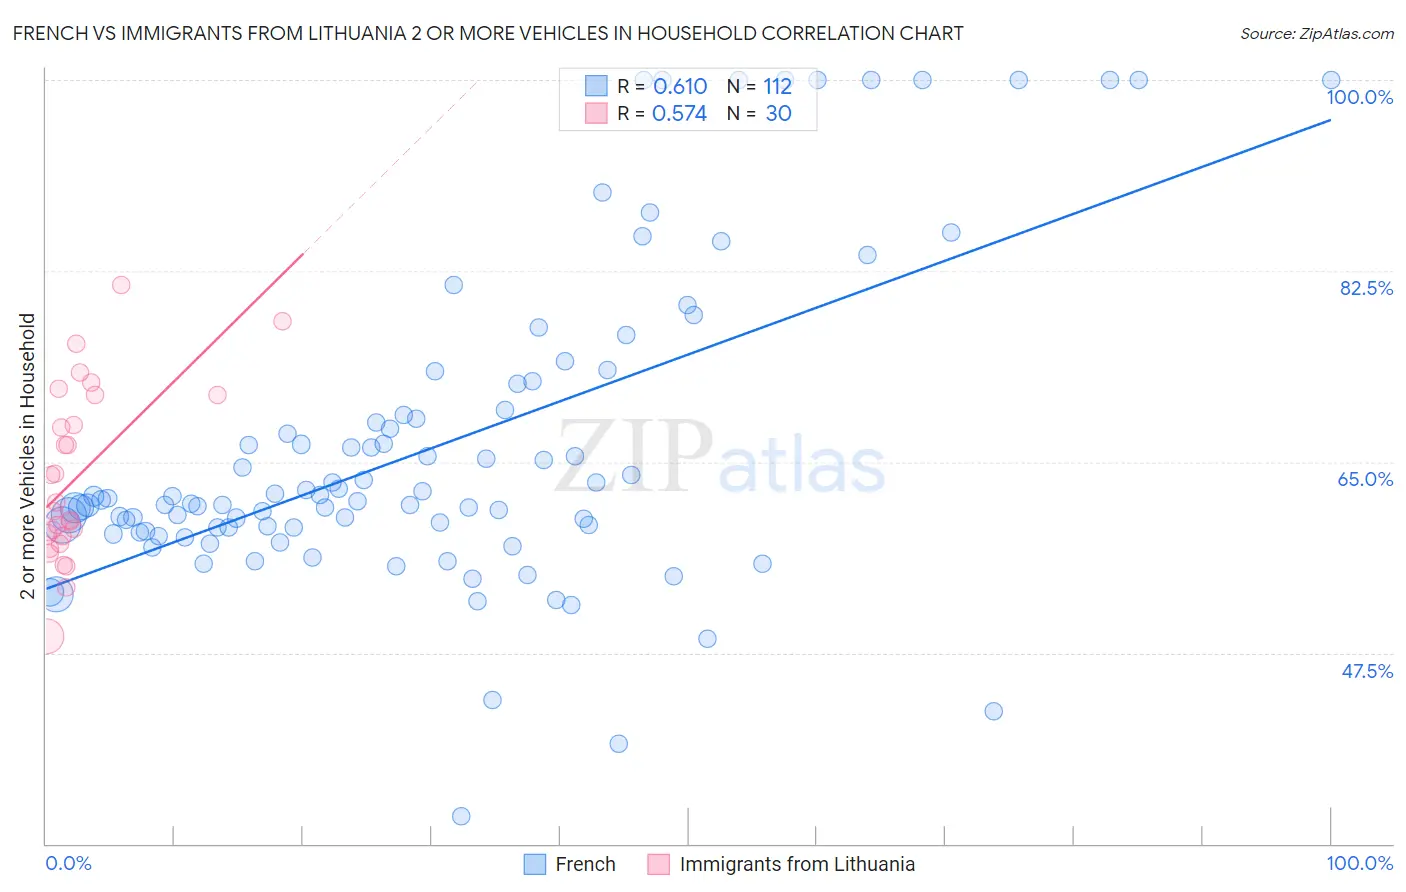
French vs Immigrants from Lithuania 2 or more Vehicles in Household Correlation Chart
The statistical analysis conducted on geographies consisting of 571,870,956 people shows a significant positive correlation between the proportion of French and percentage of households with 2 or more vehicles available in the United States with a correlation coefficient (R) of 0.610 and weighted average of 59.8%. Similarly, the statistical analysis conducted on geographies consisting of 117,713,976 people shows a substantial positive correlation between the proportion of Immigrants from Lithuania and percentage of households with 2 or more vehicles available in the United States with a correlation coefficient (R) of 0.574 and weighted average of 55.8%, a difference of 7.0%.
2 or more Vehicles in Household Correlation Summary
| Measurement | French | Immigrants from Lithuania |
| Minimum | 32.5% | 49.0% |
| Maximum | 100.0% | 81.2% |
| Range | 67.5% | 32.3% |
| Mean | 66.4% | 63.7% |
| Median | 61.5% | 60.9% |
| Interquartile 25% (IQ1) | 58.8% | 58.2% |
| Interquartile 75% (IQ3) | 69.5% | 71.1% |
| Interquartile Range (IQR) | 10.7% | 12.9% |
| Standard Deviation (Sample) | 14.5% | 7.9% |
| Standard Deviation (Population) | 14.4% | 7.8% |
Similar Demographics by 2 or more Vehicles in Household
Demographics Similar to French by 2 or more Vehicles in Household
In terms of 2 or more vehicles in household, the demographic groups most similar to French are Immigrants from Taiwan (59.7%, a difference of 0.040%), Czechoslovakian (59.8%, a difference of 0.060%), Malaysian (59.8%, a difference of 0.14%), Northern European (59.9%, a difference of 0.15%), and Cherokee (59.9%, a difference of 0.17%).
| Demographics | Rating | Rank | 2 or more Vehicles in Household |
| Irish | 100.0 /100 | #37 | Exceptional 60.1% |
| Americans | 100.0 /100 | #38 | Exceptional 60.0% |
| British | 100.0 /100 | #39 | Exceptional 60.0% |
| Cherokee | 100.0 /100 | #40 | Exceptional 59.9% |
| Northern Europeans | 100.0 /100 | #41 | Exceptional 59.9% |
| Malaysians | 100.0 /100 | #42 | Exceptional 59.8% |
| Czechoslovakians | 100.0 /100 | #43 | Exceptional 59.8% |
| French | 100.0 /100 | #44 | Exceptional 59.8% |
| Immigrants | Taiwan | 100.0 /100 | #45 | Exceptional 59.7% |
| Immigrants | South Eastern Asia | 100.0 /100 | #46 | Exceptional 59.6% |
| Yaqui | 99.9 /100 | #47 | Exceptional 59.3% |
| Immigrants | India | 99.9 /100 | #48 | Exceptional 59.3% |
| Belgians | 99.9 /100 | #49 | Exceptional 59.3% |
| Choctaw | 99.9 /100 | #50 | Exceptional 59.3% |
| Spaniards | 99.9 /100 | #51 | Exceptional 59.2% |
Demographics Similar to Immigrants from Lithuania by 2 or more Vehicles in Household
In terms of 2 or more vehicles in household, the demographic groups most similar to Immigrants from Lithuania are Immigrants from Venezuela (55.8%, a difference of 0.010%), Immigrants from Kuwait (55.8%, a difference of 0.010%), Ukrainian (55.8%, a difference of 0.020%), Lumbee (55.9%, a difference of 0.070%), and Tlingit-Haida (55.8%, a difference of 0.090%).
| Demographics | Rating | Rank | 2 or more Vehicles in Household |
| Chileans | 80.2 /100 | #149 | Excellent 56.1% |
| Nicaraguans | 79.9 /100 | #150 | Good 56.1% |
| Immigrants | Northern Europe | 78.7 /100 | #151 | Good 56.1% |
| Immigrants | Pakistan | 78.1 /100 | #152 | Good 56.1% |
| Lumbee | 71.9 /100 | #153 | Good 55.9% |
| Ukrainians | 70.8 /100 | #154 | Good 55.8% |
| Immigrants | Venezuela | 70.7 /100 | #155 | Good 55.8% |
| Immigrants | Lithuania | 70.4 /100 | #156 | Good 55.8% |
| Immigrants | Kuwait | 70.2 /100 | #157 | Good 55.8% |
| Tlingit-Haida | 68.5 /100 | #158 | Good 55.8% |
| Paiute | 68.0 /100 | #159 | Good 55.8% |
| Crow | 67.0 /100 | #160 | Good 55.7% |
| Colville | 61.1 /100 | #161 | Good 55.6% |
| German Russians | 60.9 /100 | #162 | Good 55.6% |
| Immigrants | Zimbabwe | 60.2 /100 | #163 | Good 55.6% |