Immigrants from Switzerland vs Immigrants from Russia 2 or more Vehicles in Household
COMPARE
Immigrants from Switzerland
Immigrants from Russia
2 or more Vehicles in Household
2 or more Vehicles in Household Comparison
Immigrants from Switzerland
Immigrants from Russia
53.4%
2 OR MORE VEHICLES IN HOUSEHOLD
3.0/ 100
METRIC RATING
234th/ 347
METRIC RANK
50.3%
2 OR MORE VEHICLES IN HOUSEHOLD
0.0/ 100
METRIC RATING
300th/ 347
METRIC RANK
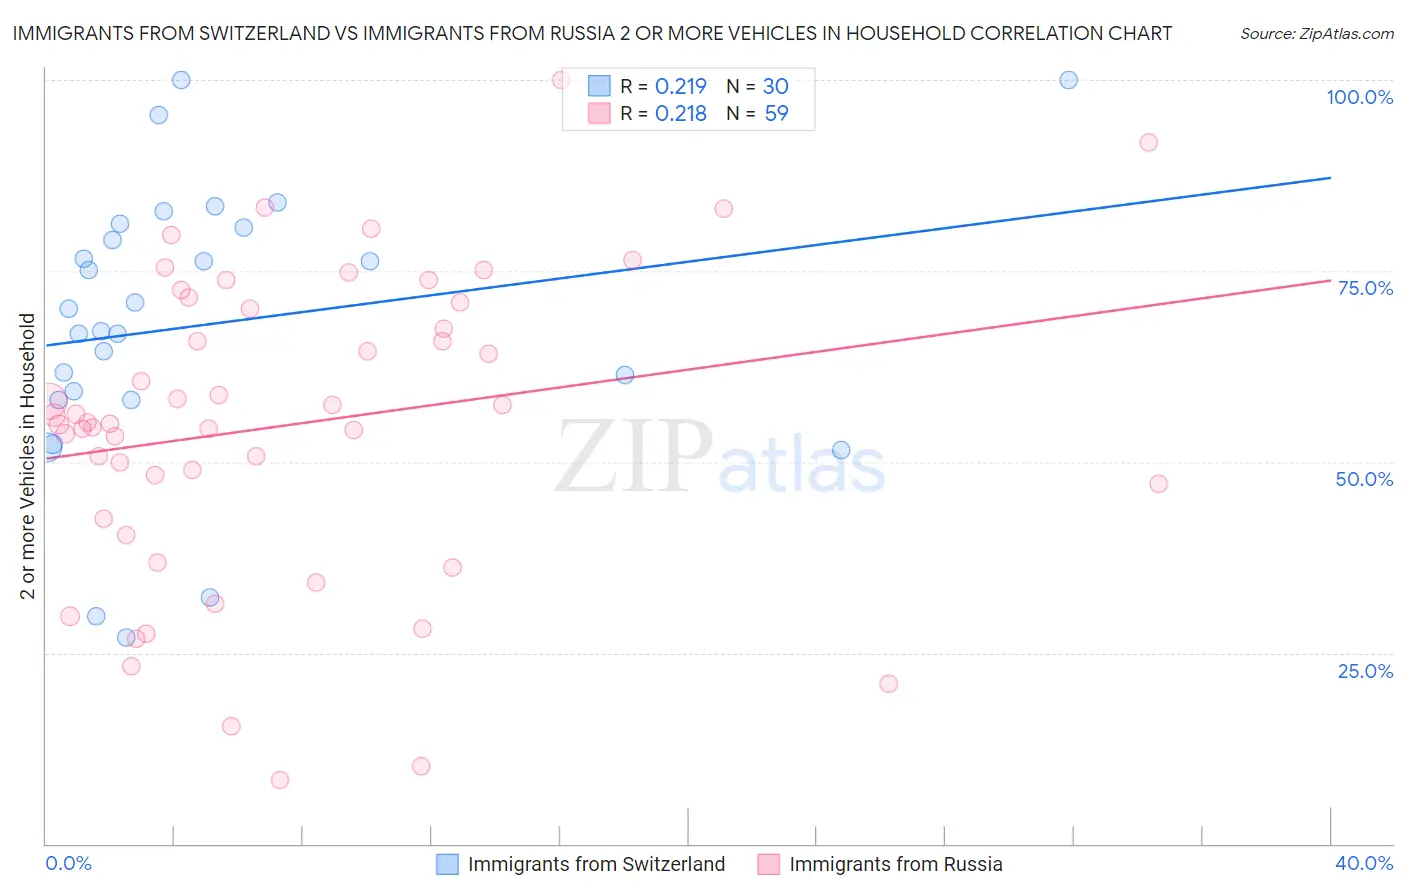
Immigrants from Switzerland vs Immigrants from Russia 2 or more Vehicles in Household Correlation Chart
The statistical analysis conducted on geographies consisting of 148,072,536 people shows a weak positive correlation between the proportion of Immigrants from Switzerland and percentage of households with 2 or more vehicles available in the United States with a correlation coefficient (R) of 0.219 and weighted average of 53.4%. Similarly, the statistical analysis conducted on geographies consisting of 347,736,627 people shows a weak positive correlation between the proportion of Immigrants from Russia and percentage of households with 2 or more vehicles available in the United States with a correlation coefficient (R) of 0.218 and weighted average of 50.3%, a difference of 6.2%.
2 or more Vehicles in Household Correlation Summary
| Measurement | Immigrants from Switzerland | Immigrants from Russia |
| Minimum | 27.0% | 8.3% |
| Maximum | 100.0% | 100.0% |
| Range | 73.0% | 91.7% |
| Mean | 68.0% | 54.9% |
| Median | 68.6% | 55.2% |
| Interquartile 25% (IQ1) | 58.2% | 42.6% |
| Interquartile 75% (IQ3) | 80.7% | 70.9% |
| Interquartile Range (IQR) | 22.5% | 28.3% |
| Standard Deviation (Sample) | 18.4% | 20.1% |
| Standard Deviation (Population) | 18.1% | 19.9% |
Similar Demographics by 2 or more Vehicles in Household
Demographics Similar to Immigrants from Switzerland by 2 or more Vehicles in Household
In terms of 2 or more vehicles in household, the demographic groups most similar to Immigrants from Switzerland are Immigrants from Middle Africa (53.4%, a difference of 0.030%), Immigrants from Guatemala (53.5%, a difference of 0.060%), Ugandan (53.5%, a difference of 0.060%), Panamanian (53.5%, a difference of 0.13%), and Indonesian (53.4%, a difference of 0.13%).
| Demographics | Rating | Rank | 2 or more Vehicles in Household |
| Sudanese | 4.1 /100 | #227 | Tragic 53.6% |
| Alaska Natives | 3.9 /100 | #228 | Tragic 53.6% |
| Immigrants | Turkey | 3.8 /100 | #229 | Tragic 53.6% |
| Immigrants | Nepal | 3.6 /100 | #230 | Tragic 53.5% |
| Panamanians | 3.4 /100 | #231 | Tragic 53.5% |
| Immigrants | Guatemala | 3.2 /100 | #232 | Tragic 53.5% |
| Ugandans | 3.2 /100 | #233 | Tragic 53.5% |
| Immigrants | Switzerland | 3.0 /100 | #234 | Tragic 53.4% |
| Immigrants | Middle Africa | 3.0 /100 | #235 | Tragic 53.4% |
| Indonesians | 2.7 /100 | #236 | Tragic 53.4% |
| Macedonians | 2.4 /100 | #237 | Tragic 53.3% |
| Immigrants | Armenia | 2.3 /100 | #238 | Tragic 53.3% |
| Cambodians | 2.3 /100 | #239 | Tragic 53.3% |
| Immigrants | Europe | 2.1 /100 | #240 | Tragic 53.2% |
| Immigrants | Sierra Leone | 2.1 /100 | #241 | Tragic 53.2% |
Demographics Similar to Immigrants from Russia by 2 or more Vehicles in Household
In terms of 2 or more vehicles in household, the demographic groups most similar to Immigrants from Russia are Immigrants from Morocco (50.3%, a difference of 0.040%), Paraguayan (50.3%, a difference of 0.070%), Immigrants from Greece (50.2%, a difference of 0.18%), Immigrants from Spain (50.4%, a difference of 0.20%), and Immigrants from South America (50.2%, a difference of 0.24%).
| Demographics | Rating | Rank | 2 or more Vehicles in Household |
| Blacks/African Americans | 0.0 /100 | #293 | Tragic 50.9% |
| Bermudans | 0.0 /100 | #294 | Tragic 50.6% |
| Cypriots | 0.0 /100 | #295 | Tragic 50.6% |
| Immigrants | Somalia | 0.0 /100 | #296 | Tragic 50.5% |
| Immigrants | Spain | 0.0 /100 | #297 | Tragic 50.4% |
| Paraguayans | 0.0 /100 | #298 | Tragic 50.3% |
| Immigrants | Morocco | 0.0 /100 | #299 | Tragic 50.3% |
| Immigrants | Russia | 0.0 /100 | #300 | Tragic 50.3% |
| Immigrants | Greece | 0.0 /100 | #301 | Tragic 50.2% |
| Immigrants | South America | 0.0 /100 | #302 | Tragic 50.2% |
| Tohono O'odham | 0.0 /100 | #303 | Tragic 50.0% |
| Immigrants | Belize | 0.0 /100 | #304 | Tragic 49.9% |
| Immigrants | Western Africa | 0.0 /100 | #305 | Tragic 49.4% |
| Immigrants | Israel | 0.0 /100 | #306 | Tragic 49.2% |
| Hopi | 0.0 /100 | #307 | Tragic 49.0% |