Immigrants from Sudan vs Brazilian 2 or more Vehicles in Household
COMPARE
Immigrants from Sudan
Brazilian
2 or more Vehicles in Household
2 or more Vehicles in Household Comparison
Immigrants from Sudan
Brazilians
52.8%
2 OR MORE VEHICLES IN HOUSEHOLD
1.0/ 100
METRIC RATING
251st/ 347
METRIC RANK
53.8%
2 OR MORE VEHICLES IN HOUSEHOLD
5.3/ 100
METRIC RATING
224th/ 347
METRIC RANK
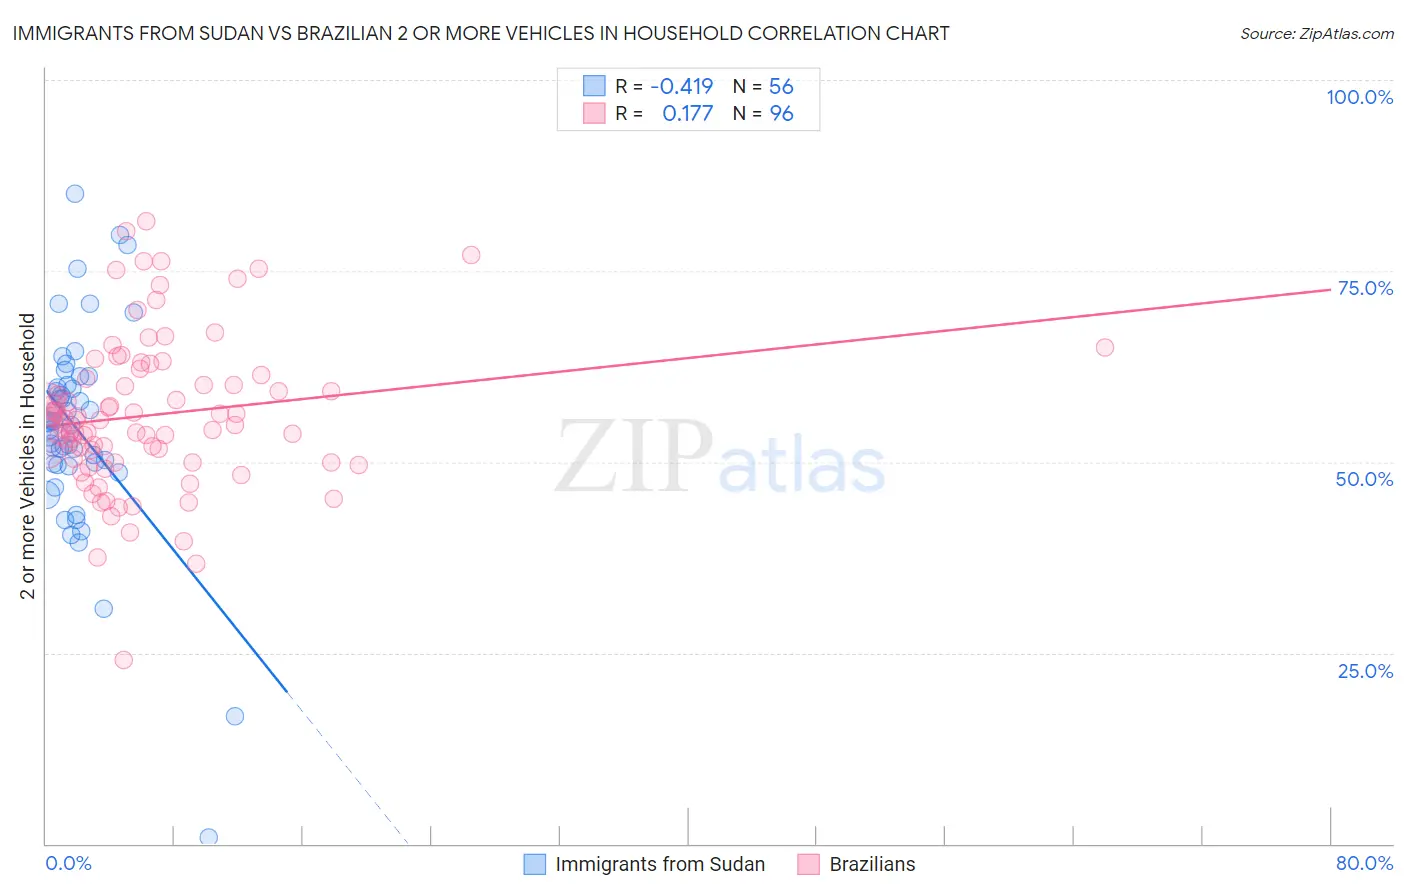
Immigrants from Sudan vs Brazilian 2 or more Vehicles in Household Correlation Chart
The statistical analysis conducted on geographies consisting of 118,954,580 people shows a moderate negative correlation between the proportion of Immigrants from Sudan and percentage of households with 2 or more vehicles available in the United States with a correlation coefficient (R) of -0.419 and weighted average of 52.8%. Similarly, the statistical analysis conducted on geographies consisting of 323,674,427 people shows a poor positive correlation between the proportion of Brazilians and percentage of households with 2 or more vehicles available in the United States with a correlation coefficient (R) of 0.177 and weighted average of 53.8%, a difference of 1.8%.
2 or more Vehicles in Household Correlation Summary
| Measurement | Immigrants from Sudan | Brazilian |
| Minimum | 0.83% | 24.1% |
| Maximum | 85.2% | 81.5% |
| Range | 84.3% | 57.4% |
| Mean | 54.2% | 56.1% |
| Median | 55.0% | 55.4% |
| Interquartile 25% (IQ1) | 49.7% | 50.2% |
| Interquartile 75% (IQ3) | 59.9% | 61.1% |
| Interquartile Range (IQR) | 10.2% | 10.9% |
| Standard Deviation (Sample) | 13.6% | 10.0% |
| Standard Deviation (Population) | 13.5% | 9.9% |
Similar Demographics by 2 or more Vehicles in Household
Demographics Similar to Immigrants from Sudan by 2 or more Vehicles in Household
In terms of 2 or more vehicles in household, the demographic groups most similar to Immigrants from Sudan are Immigrants from Portugal (52.8%, a difference of 0.010%), Mongolian (52.8%, a difference of 0.030%), Immigrants from Brazil (52.8%, a difference of 0.040%), Nigerian (52.8%, a difference of 0.060%), and Colombian (52.9%, a difference of 0.090%).
| Demographics | Rating | Rank | 2 or more Vehicles in Household |
| Indians (Asian) | 1.7 /100 | #244 | Tragic 53.1% |
| Immigrants | Ethiopia | 1.5 /100 | #245 | Tragic 53.0% |
| Immigrants | Nigeria | 1.2 /100 | #246 | Tragic 52.9% |
| Sierra Leoneans | 1.2 /100 | #247 | Tragic 52.9% |
| Colombians | 1.1 /100 | #248 | Tragic 52.9% |
| Immigrants | Brazil | 1.0 /100 | #249 | Tragic 52.8% |
| Mongolians | 1.0 /100 | #250 | Tragic 52.8% |
| Immigrants | Sudan | 1.0 /100 | #251 | Tragic 52.8% |
| Immigrants | Portugal | 1.0 /100 | #252 | Tragic 52.8% |
| Nigerians | 0.9 /100 | #253 | Tragic 52.8% |
| Immigrants | Malaysia | 0.8 /100 | #254 | Tragic 52.7% |
| Uruguayans | 0.7 /100 | #255 | Tragic 52.7% |
| Immigrants | Eritrea | 0.7 /100 | #256 | Tragic 52.6% |
| Immigrants | Hong Kong | 0.6 /100 | #257 | Tragic 52.6% |
| Central American Indians | 0.6 /100 | #258 | Tragic 52.5% |
Demographics Similar to Brazilians by 2 or more Vehicles in Household
In terms of 2 or more vehicles in household, the demographic groups most similar to Brazilians are Immigrants from Egypt (53.8%, a difference of 0.010%), Immigrants from Eastern Africa (53.7%, a difference of 0.030%), Immigrants from Bosnia and Herzegovina (53.8%, a difference of 0.040%), Kiowa (53.9%, a difference of 0.17%), and Immigrants from Singapore (53.9%, a difference of 0.19%).
| Demographics | Rating | Rank | 2 or more Vehicles in Household |
| Immigrants | Burma/Myanmar | 7.1 /100 | #217 | Tragic 53.9% |
| Immigrants | Argentina | 6.8 /100 | #218 | Tragic 53.9% |
| South American Indians | 6.5 /100 | #219 | Tragic 53.9% |
| Taiwanese | 6.3 /100 | #220 | Tragic 53.9% |
| Immigrants | Singapore | 6.3 /100 | #221 | Tragic 53.9% |
| Kiowa | 6.2 /100 | #222 | Tragic 53.9% |
| Immigrants | Bosnia and Herzegovina | 5.5 /100 | #223 | Tragic 53.8% |
| Brazilians | 5.3 /100 | #224 | Tragic 53.8% |
| Immigrants | Egypt | 5.2 /100 | #225 | Tragic 53.8% |
| Immigrants | Eastern Africa | 5.1 /100 | #226 | Tragic 53.7% |
| Sudanese | 4.1 /100 | #227 | Tragic 53.6% |
| Alaska Natives | 3.9 /100 | #228 | Tragic 53.6% |
| Immigrants | Turkey | 3.8 /100 | #229 | Tragic 53.6% |
| Immigrants | Nepal | 3.6 /100 | #230 | Tragic 53.5% |
| Panamanians | 3.4 /100 | #231 | Tragic 53.5% |