Immigrants from Zaire vs Brazilian 2 or more Vehicles in Household
COMPARE
Immigrants from Zaire
Brazilian
2 or more Vehicles in Household
2 or more Vehicles in Household Comparison
Immigrants from Zaire
Brazilians
51.5%
2 OR MORE VEHICLES IN HOUSEHOLD
0.1/ 100
METRIC RATING
284th/ 347
METRIC RANK
53.8%
2 OR MORE VEHICLES IN HOUSEHOLD
5.3/ 100
METRIC RATING
224th/ 347
METRIC RANK
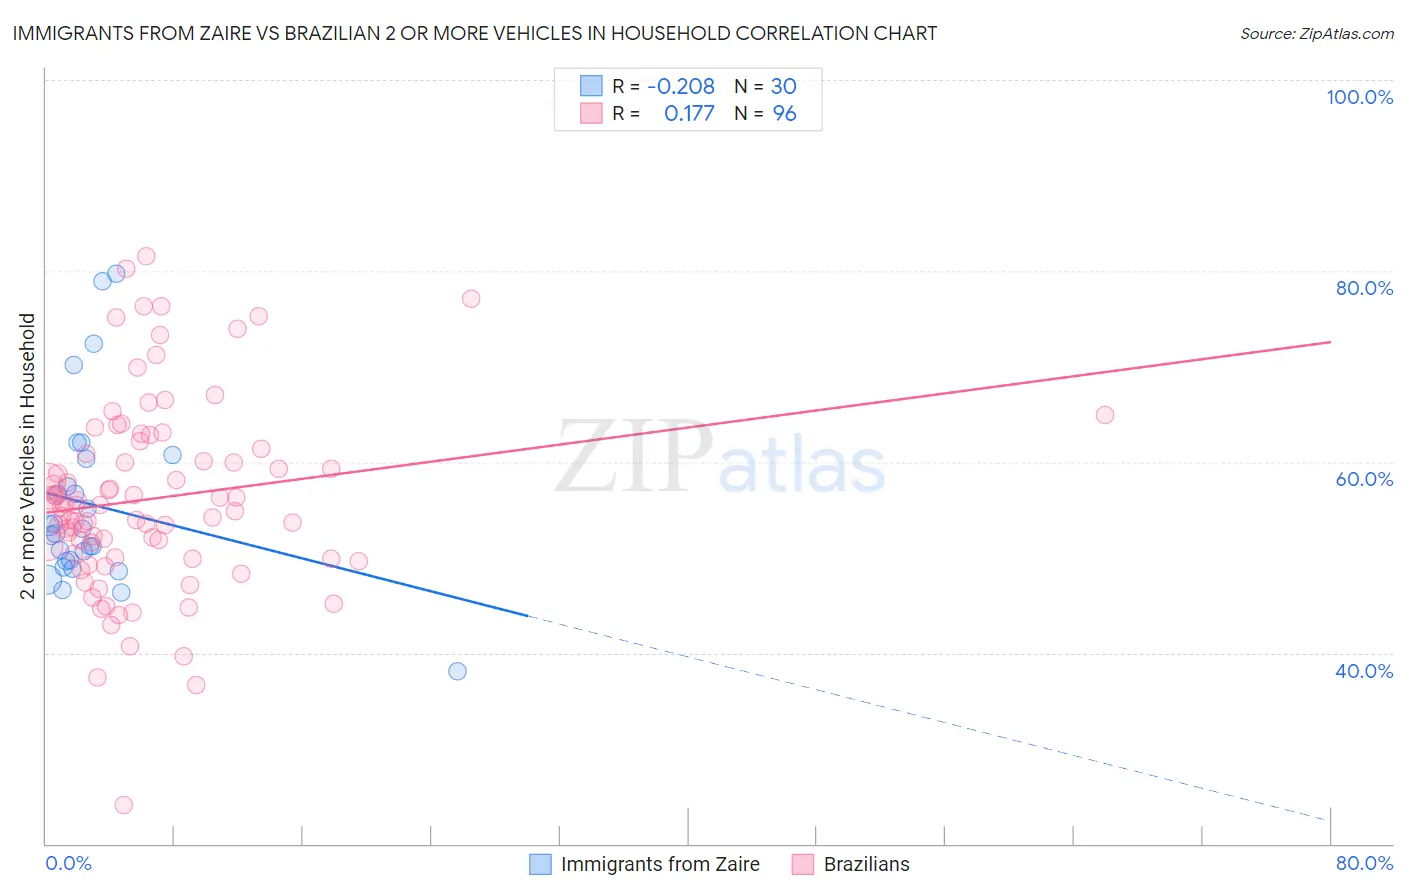
Immigrants from Zaire vs Brazilian 2 or more Vehicles in Household Correlation Chart
The statistical analysis conducted on geographies consisting of 107,246,082 people shows a weak negative correlation between the proportion of Immigrants from Zaire and percentage of households with 2 or more vehicles available in the United States with a correlation coefficient (R) of -0.208 and weighted average of 51.5%. Similarly, the statistical analysis conducted on geographies consisting of 323,674,427 people shows a poor positive correlation between the proportion of Brazilians and percentage of households with 2 or more vehicles available in the United States with a correlation coefficient (R) of 0.177 and weighted average of 53.8%, a difference of 4.4%.
2 or more Vehicles in Household Correlation Summary
| Measurement | Immigrants from Zaire | Brazilian |
| Minimum | 38.1% | 24.1% |
| Maximum | 79.7% | 81.5% |
| Range | 41.6% | 57.4% |
| Mean | 55.5% | 56.1% |
| Median | 52.7% | 55.4% |
| Interquartile 25% (IQ1) | 49.5% | 50.2% |
| Interquartile 75% (IQ3) | 60.4% | 61.1% |
| Interquartile Range (IQR) | 10.8% | 10.9% |
| Standard Deviation (Sample) | 9.5% | 10.0% |
| Standard Deviation (Population) | 9.4% | 9.9% |
Similar Demographics by 2 or more Vehicles in Household
Demographics Similar to Immigrants from Zaire by 2 or more Vehicles in Household
In terms of 2 or more vehicles in household, the demographic groups most similar to Immigrants from Zaire are Immigrants from China (51.5%, a difference of 0.040%), Bahamian (51.5%, a difference of 0.12%), Immigrants from Uruguay (51.4%, a difference of 0.16%), Immigrants from Kazakhstan (51.6%, a difference of 0.18%), and Immigrants from Liberia (51.3%, a difference of 0.30%).
| Demographics | Rating | Rank | 2 or more Vehicles in Household |
| Immigrants | Africa | 0.2 /100 | #277 | Tragic 51.8% |
| Yuman | 0.1 /100 | #278 | Tragic 51.7% |
| Liberians | 0.1 /100 | #279 | Tragic 51.7% |
| Immigrants | Eastern Europe | 0.1 /100 | #280 | Tragic 51.7% |
| Immigrants | Kazakhstan | 0.1 /100 | #281 | Tragic 51.6% |
| Bahamians | 0.1 /100 | #282 | Tragic 51.5% |
| Immigrants | China | 0.1 /100 | #283 | Tragic 51.5% |
| Immigrants | Zaire | 0.1 /100 | #284 | Tragic 51.5% |
| Immigrants | Uruguay | 0.1 /100 | #285 | Tragic 51.4% |
| Immigrants | Liberia | 0.1 /100 | #286 | Tragic 51.3% |
| Immigrants | Serbia | 0.1 /100 | #287 | Tragic 51.3% |
| Okinawans | 0.1 /100 | #288 | Tragic 51.2% |
| Somalis | 0.0 /100 | #289 | Tragic 51.1% |
| Immigrants | Panama | 0.0 /100 | #290 | Tragic 51.1% |
| Belizeans | 0.0 /100 | #291 | Tragic 51.0% |
Demographics Similar to Brazilians by 2 or more Vehicles in Household
In terms of 2 or more vehicles in household, the demographic groups most similar to Brazilians are Immigrants from Egypt (53.8%, a difference of 0.010%), Immigrants from Eastern Africa (53.7%, a difference of 0.030%), Immigrants from Bosnia and Herzegovina (53.8%, a difference of 0.040%), Kiowa (53.9%, a difference of 0.17%), and Immigrants from Singapore (53.9%, a difference of 0.19%).
| Demographics | Rating | Rank | 2 or more Vehicles in Household |
| Immigrants | Burma/Myanmar | 7.1 /100 | #217 | Tragic 53.9% |
| Immigrants | Argentina | 6.8 /100 | #218 | Tragic 53.9% |
| South American Indians | 6.5 /100 | #219 | Tragic 53.9% |
| Taiwanese | 6.3 /100 | #220 | Tragic 53.9% |
| Immigrants | Singapore | 6.3 /100 | #221 | Tragic 53.9% |
| Kiowa | 6.2 /100 | #222 | Tragic 53.9% |
| Immigrants | Bosnia and Herzegovina | 5.5 /100 | #223 | Tragic 53.8% |
| Brazilians | 5.3 /100 | #224 | Tragic 53.8% |
| Immigrants | Egypt | 5.2 /100 | #225 | Tragic 53.8% |
| Immigrants | Eastern Africa | 5.1 /100 | #226 | Tragic 53.7% |
| Sudanese | 4.1 /100 | #227 | Tragic 53.6% |
| Alaska Natives | 3.9 /100 | #228 | Tragic 53.6% |
| Immigrants | Turkey | 3.8 /100 | #229 | Tragic 53.6% |
| Immigrants | Nepal | 3.6 /100 | #230 | Tragic 53.5% |
| Panamanians | 3.4 /100 | #231 | Tragic 53.5% |