Immigrants from Sudan vs Eastern European 2 or more Vehicles in Household
COMPARE
Immigrants from Sudan
Eastern European
2 or more Vehicles in Household
2 or more Vehicles in Household Comparison
Immigrants from Sudan
Eastern Europeans
52.8%
2 OR MORE VEHICLES IN HOUSEHOLD
1.0/ 100
METRIC RATING
251st/ 347
METRIC RANK
54.8%
2 OR MORE VEHICLES IN HOUSEHOLD
27.5/ 100
METRIC RATING
189th/ 347
METRIC RANK
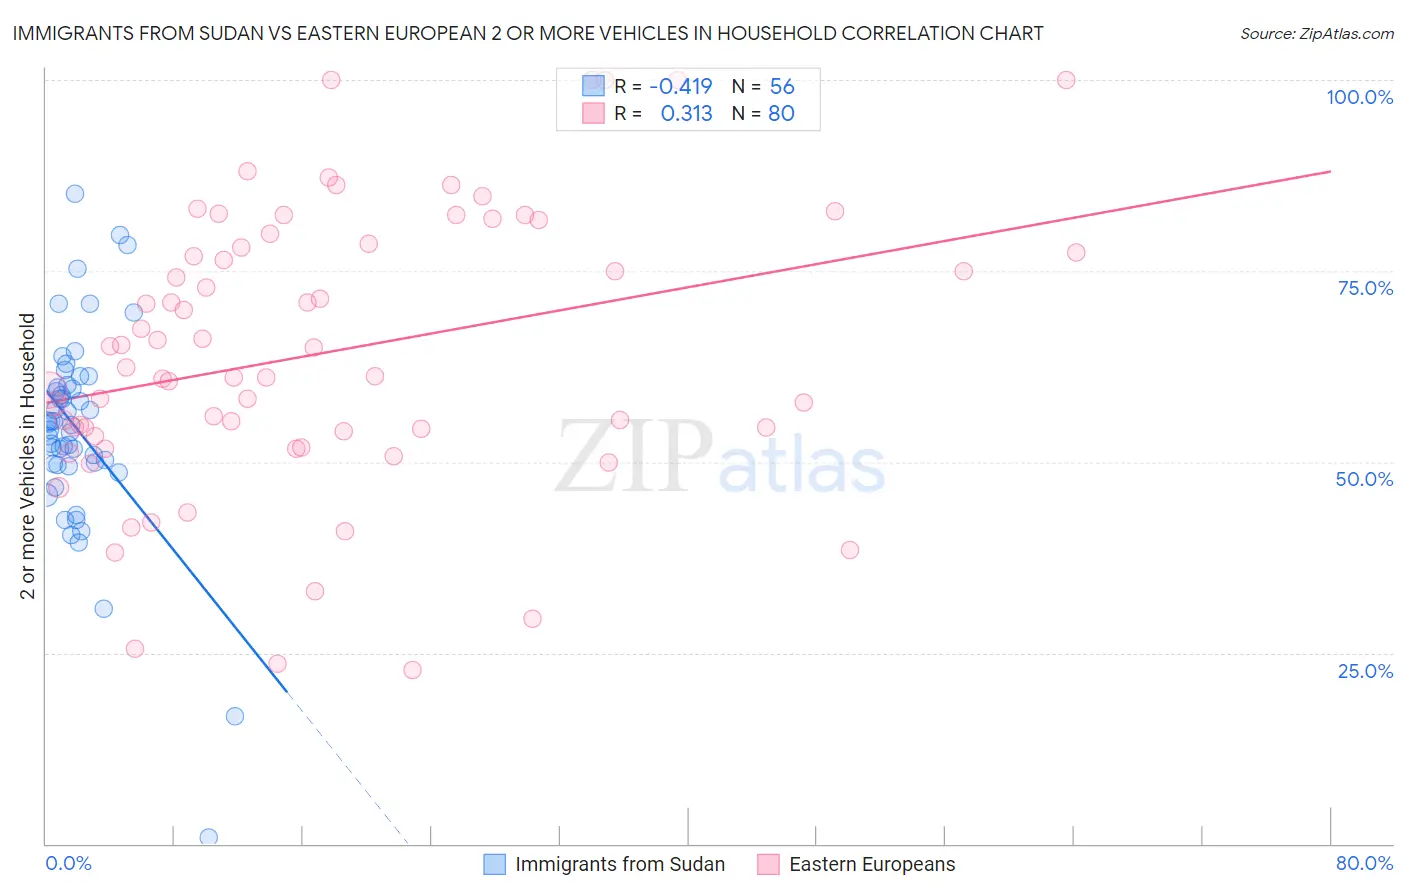
Immigrants from Sudan vs Eastern European 2 or more Vehicles in Household Correlation Chart
The statistical analysis conducted on geographies consisting of 118,954,580 people shows a moderate negative correlation between the proportion of Immigrants from Sudan and percentage of households with 2 or more vehicles available in the United States with a correlation coefficient (R) of -0.419 and weighted average of 52.8%. Similarly, the statistical analysis conducted on geographies consisting of 460,977,984 people shows a mild positive correlation between the proportion of Eastern Europeans and percentage of households with 2 or more vehicles available in the United States with a correlation coefficient (R) of 0.313 and weighted average of 54.8%, a difference of 3.8%.
2 or more Vehicles in Household Correlation Summary
| Measurement | Immigrants from Sudan | Eastern European |
| Minimum | 0.83% | 22.8% |
| Maximum | 85.2% | 100.0% |
| Range | 84.3% | 77.2% |
| Mean | 54.2% | 64.3% |
| Median | 55.0% | 61.9% |
| Interquartile 25% (IQ1) | 49.7% | 53.7% |
| Interquartile 75% (IQ3) | 59.9% | 78.3% |
| Interquartile Range (IQR) | 10.2% | 24.6% |
| Standard Deviation (Sample) | 13.6% | 18.3% |
| Standard Deviation (Population) | 13.5% | 18.2% |
Similar Demographics by 2 or more Vehicles in Household
Demographics Similar to Immigrants from Sudan by 2 or more Vehicles in Household
In terms of 2 or more vehicles in household, the demographic groups most similar to Immigrants from Sudan are Immigrants from Portugal (52.8%, a difference of 0.010%), Mongolian (52.8%, a difference of 0.030%), Immigrants from Brazil (52.8%, a difference of 0.040%), Nigerian (52.8%, a difference of 0.060%), and Colombian (52.9%, a difference of 0.090%).
| Demographics | Rating | Rank | 2 or more Vehicles in Household |
| Indians (Asian) | 1.7 /100 | #244 | Tragic 53.1% |
| Immigrants | Ethiopia | 1.5 /100 | #245 | Tragic 53.0% |
| Immigrants | Nigeria | 1.2 /100 | #246 | Tragic 52.9% |
| Sierra Leoneans | 1.2 /100 | #247 | Tragic 52.9% |
| Colombians | 1.1 /100 | #248 | Tragic 52.9% |
| Immigrants | Brazil | 1.0 /100 | #249 | Tragic 52.8% |
| Mongolians | 1.0 /100 | #250 | Tragic 52.8% |
| Immigrants | Sudan | 1.0 /100 | #251 | Tragic 52.8% |
| Immigrants | Portugal | 1.0 /100 | #252 | Tragic 52.8% |
| Nigerians | 0.9 /100 | #253 | Tragic 52.8% |
| Immigrants | Malaysia | 0.8 /100 | #254 | Tragic 52.7% |
| Uruguayans | 0.7 /100 | #255 | Tragic 52.7% |
| Immigrants | Eritrea | 0.7 /100 | #256 | Tragic 52.6% |
| Immigrants | Hong Kong | 0.6 /100 | #257 | Tragic 52.6% |
| Central American Indians | 0.6 /100 | #258 | Tragic 52.5% |
Demographics Similar to Eastern Europeans by 2 or more Vehicles in Household
In terms of 2 or more vehicles in household, the demographic groups most similar to Eastern Europeans are Russian (54.8%, a difference of 0.060%), Immigrants (54.7%, a difference of 0.13%), Marshallese (54.9%, a difference of 0.15%), Immigrants from Romania (54.7%, a difference of 0.20%), and Immigrants from Japan (54.7%, a difference of 0.22%).
| Demographics | Rating | Rank | 2 or more Vehicles in Household |
| Cree | 38.2 /100 | #182 | Fair 55.1% |
| Immigrants | Cameroon | 37.3 /100 | #183 | Fair 55.1% |
| Apache | 36.7 /100 | #184 | Fair 55.1% |
| Arabs | 35.9 /100 | #185 | Fair 55.0% |
| Peruvians | 33.7 /100 | #186 | Fair 55.0% |
| Immigrants | Uganda | 33.4 /100 | #187 | Fair 55.0% |
| Marshallese | 30.5 /100 | #188 | Fair 54.9% |
| Eastern Europeans | 27.5 /100 | #189 | Fair 54.8% |
| Russians | 26.3 /100 | #190 | Fair 54.8% |
| Immigrants | Immigrants | 25.0 /100 | #191 | Fair 54.7% |
| Immigrants | Romania | 23.8 /100 | #192 | Fair 54.7% |
| Immigrants | Japan | 23.4 /100 | #193 | Fair 54.7% |
| Central Americans | 23.0 /100 | #194 | Fair 54.7% |
| Iroquois | 22.6 /100 | #195 | Fair 54.7% |
| Immigrants | Poland | 19.3 /100 | #196 | Poor 54.6% |