Immigrants from Sudan vs Immigrants from Micronesia 2 or more Vehicles in Household
COMPARE
Immigrants from Sudan
Immigrants from Micronesia
2 or more Vehicles in Household
2 or more Vehicles in Household Comparison
Immigrants from Sudan
Immigrants from Micronesia
52.8%
2 OR MORE VEHICLES IN HOUSEHOLD
1.0/ 100
METRIC RATING
251st/ 347
METRIC RANK
55.1%
2 OR MORE VEHICLES IN HOUSEHOLD
38.2/ 100
METRIC RATING
181st/ 347
METRIC RANK
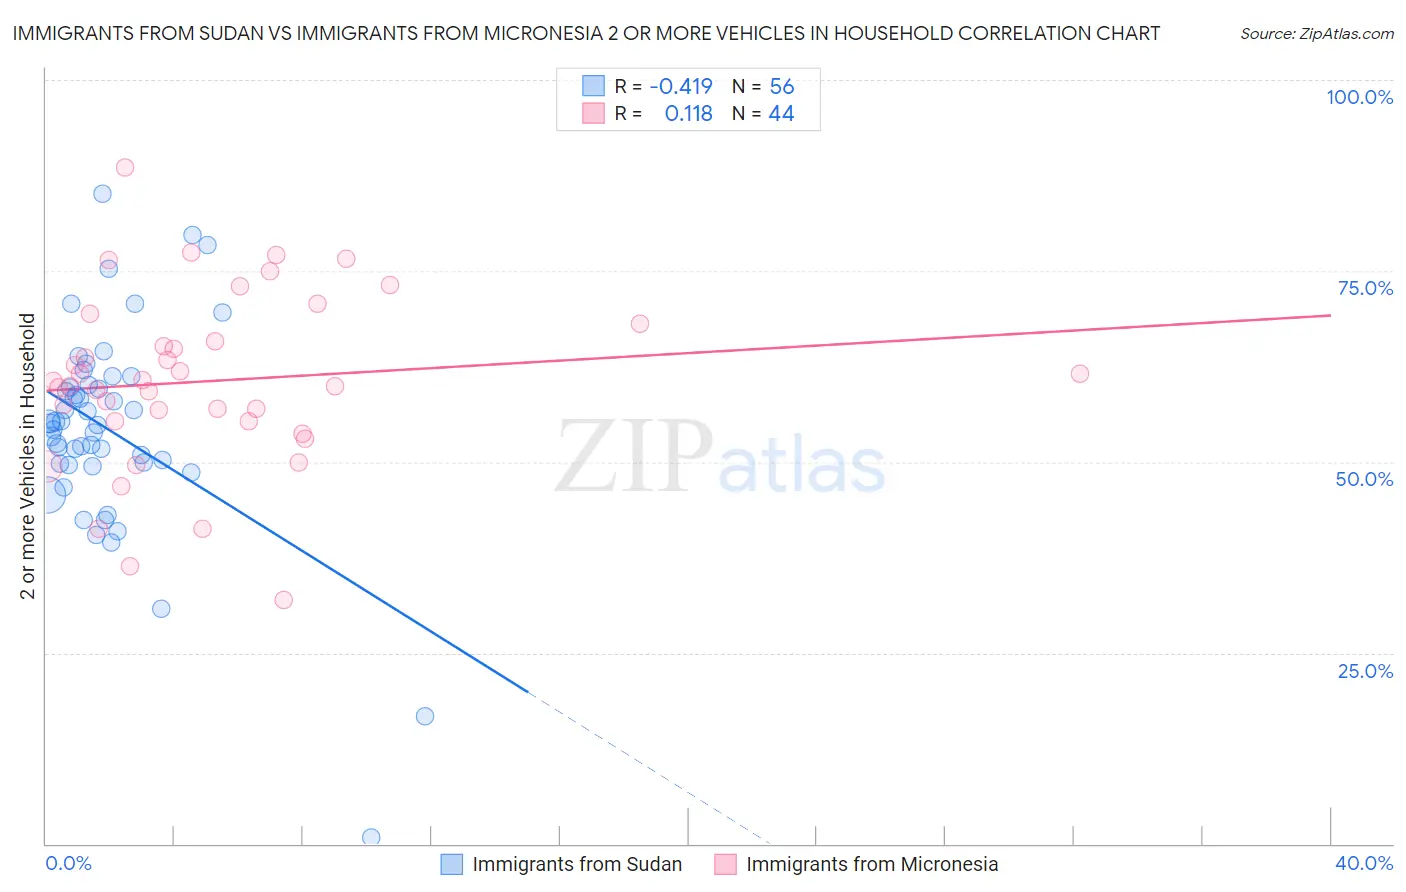
Immigrants from Sudan vs Immigrants from Micronesia 2 or more Vehicles in Household Correlation Chart
The statistical analysis conducted on geographies consisting of 118,954,580 people shows a moderate negative correlation between the proportion of Immigrants from Sudan and percentage of households with 2 or more vehicles available in the United States with a correlation coefficient (R) of -0.419 and weighted average of 52.8%. Similarly, the statistical analysis conducted on geographies consisting of 61,601,070 people shows a poor positive correlation between the proportion of Immigrants from Micronesia and percentage of households with 2 or more vehicles available in the United States with a correlation coefficient (R) of 0.118 and weighted average of 55.1%, a difference of 4.3%.
2 or more Vehicles in Household Correlation Summary
| Measurement | Immigrants from Sudan | Immigrants from Micronesia |
| Minimum | 0.83% | 31.9% |
| Maximum | 85.2% | 88.6% |
| Range | 84.3% | 56.6% |
| Mean | 54.2% | 60.6% |
| Median | 55.0% | 60.3% |
| Interquartile 25% (IQ1) | 49.7% | 55.3% |
| Interquartile 75% (IQ3) | 59.9% | 66.9% |
| Interquartile Range (IQR) | 10.2% | 11.6% |
| Standard Deviation (Sample) | 13.6% | 11.4% |
| Standard Deviation (Population) | 13.5% | 11.3% |
Similar Demographics by 2 or more Vehicles in Household
Demographics Similar to Immigrants from Sudan by 2 or more Vehicles in Household
In terms of 2 or more vehicles in household, the demographic groups most similar to Immigrants from Sudan are Immigrants from Portugal (52.8%, a difference of 0.010%), Mongolian (52.8%, a difference of 0.030%), Immigrants from Brazil (52.8%, a difference of 0.040%), Nigerian (52.8%, a difference of 0.060%), and Colombian (52.9%, a difference of 0.090%).
| Demographics | Rating | Rank | 2 or more Vehicles in Household |
| Indians (Asian) | 1.7 /100 | #244 | Tragic 53.1% |
| Immigrants | Ethiopia | 1.5 /100 | #245 | Tragic 53.0% |
| Immigrants | Nigeria | 1.2 /100 | #246 | Tragic 52.9% |
| Sierra Leoneans | 1.2 /100 | #247 | Tragic 52.9% |
| Colombians | 1.1 /100 | #248 | Tragic 52.9% |
| Immigrants | Brazil | 1.0 /100 | #249 | Tragic 52.8% |
| Mongolians | 1.0 /100 | #250 | Tragic 52.8% |
| Immigrants | Sudan | 1.0 /100 | #251 | Tragic 52.8% |
| Immigrants | Portugal | 1.0 /100 | #252 | Tragic 52.8% |
| Nigerians | 0.9 /100 | #253 | Tragic 52.8% |
| Immigrants | Malaysia | 0.8 /100 | #254 | Tragic 52.7% |
| Uruguayans | 0.7 /100 | #255 | Tragic 52.7% |
| Immigrants | Eritrea | 0.7 /100 | #256 | Tragic 52.6% |
| Immigrants | Hong Kong | 0.6 /100 | #257 | Tragic 52.6% |
| Central American Indians | 0.6 /100 | #258 | Tragic 52.5% |
Demographics Similar to Immigrants from Micronesia by 2 or more Vehicles in Household
In terms of 2 or more vehicles in household, the demographic groups most similar to Immigrants from Micronesia are Cree (55.1%, a difference of 0.0%), Immigrants from Cameroon (55.1%, a difference of 0.040%), Apache (55.1%, a difference of 0.060%), Immigrants from Kenya (55.1%, a difference of 0.090%), and Arab (55.0%, a difference of 0.10%).
| Demographics | Rating | Rank | 2 or more Vehicles in Household |
| Navajo | 50.0 /100 | #174 | Average 55.3% |
| Immigrants | Denmark | 49.4 /100 | #175 | Average 55.3% |
| Immigrants | Cuba | 47.0 /100 | #176 | Average 55.3% |
| Menominee | 46.2 /100 | #177 | Average 55.3% |
| Immigrants | Sweden | 45.3 /100 | #178 | Average 55.2% |
| Alaskan Athabascans | 42.9 /100 | #179 | Average 55.2% |
| Immigrants | Kenya | 40.4 /100 | #180 | Average 55.1% |
| Immigrants | Micronesia | 38.2 /100 | #181 | Fair 55.1% |
| Cree | 38.2 /100 | #182 | Fair 55.1% |
| Immigrants | Cameroon | 37.3 /100 | #183 | Fair 55.1% |
| Apache | 36.7 /100 | #184 | Fair 55.1% |
| Arabs | 35.9 /100 | #185 | Fair 55.0% |
| Peruvians | 33.7 /100 | #186 | Fair 55.0% |
| Immigrants | Uganda | 33.4 /100 | #187 | Fair 55.0% |
| Marshallese | 30.5 /100 | #188 | Fair 54.9% |