Immigrants from Australia vs Brazilian 2 or more Vehicles in Household
COMPARE
Immigrants from Australia
Brazilian
2 or more Vehicles in Household
2 or more Vehicles in Household Comparison
Immigrants from Australia
Brazilians
52.4%
2 OR MORE VEHICLES IN HOUSEHOLD
0.5/ 100
METRIC RATING
261st/ 347
METRIC RANK
53.8%
2 OR MORE VEHICLES IN HOUSEHOLD
5.3/ 100
METRIC RATING
224th/ 347
METRIC RANK
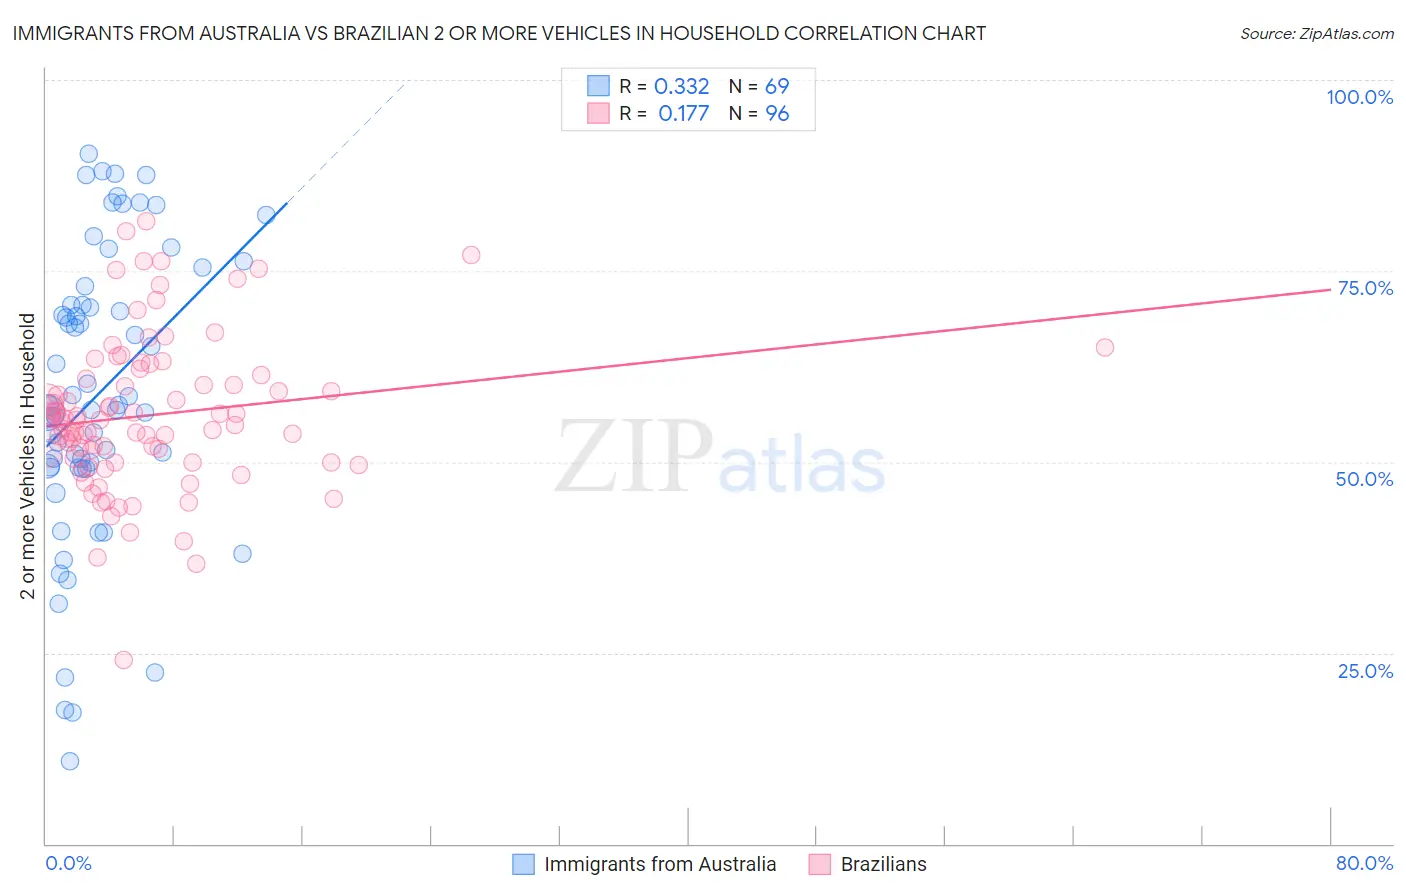
Immigrants from Australia vs Brazilian 2 or more Vehicles in Household Correlation Chart
The statistical analysis conducted on geographies consisting of 227,142,771 people shows a mild positive correlation between the proportion of Immigrants from Australia and percentage of households with 2 or more vehicles available in the United States with a correlation coefficient (R) of 0.332 and weighted average of 52.4%. Similarly, the statistical analysis conducted on geographies consisting of 323,674,427 people shows a poor positive correlation between the proportion of Brazilians and percentage of households with 2 or more vehicles available in the United States with a correlation coefficient (R) of 0.177 and weighted average of 53.8%, a difference of 2.5%.
2 or more Vehicles in Household Correlation Summary
| Measurement | Immigrants from Australia | Brazilian |
| Minimum | 10.8% | 24.1% |
| Maximum | 90.4% | 81.5% |
| Range | 79.7% | 57.4% |
| Mean | 58.9% | 56.1% |
| Median | 57.4% | 55.4% |
| Interquartile 25% (IQ1) | 49.3% | 50.2% |
| Interquartile 75% (IQ3) | 71.8% | 61.1% |
| Interquartile Range (IQR) | 22.5% | 10.9% |
| Standard Deviation (Sample) | 19.0% | 10.0% |
| Standard Deviation (Population) | 18.9% | 9.9% |
Similar Demographics by 2 or more Vehicles in Household
Demographics Similar to Immigrants from Australia by 2 or more Vehicles in Household
In terms of 2 or more vehicles in household, the demographic groups most similar to Immigrants from Australia are Immigrants from Bahamas (52.5%, a difference of 0.030%), Alsatian (52.5%, a difference of 0.10%), Central American Indian (52.5%, a difference of 0.14%), Immigrants from Northern Africa (52.3%, a difference of 0.20%), and Immigrants from Hong Kong (52.6%, a difference of 0.24%).
| Demographics | Rating | Rank | 2 or more Vehicles in Household |
| Immigrants | Malaysia | 0.8 /100 | #254 | Tragic 52.7% |
| Uruguayans | 0.7 /100 | #255 | Tragic 52.7% |
| Immigrants | Eritrea | 0.7 /100 | #256 | Tragic 52.6% |
| Immigrants | Hong Kong | 0.6 /100 | #257 | Tragic 52.6% |
| Central American Indians | 0.6 /100 | #258 | Tragic 52.5% |
| Alsatians | 0.6 /100 | #259 | Tragic 52.5% |
| Immigrants | Bahamas | 0.5 /100 | #260 | Tragic 52.5% |
| Immigrants | Australia | 0.5 /100 | #261 | Tragic 52.4% |
| Immigrants | Northern Africa | 0.4 /100 | #262 | Tragic 52.3% |
| Immigrants | Southern Europe | 0.4 /100 | #263 | Tragic 52.3% |
| Immigrants | Latvia | 0.4 /100 | #264 | Tragic 52.2% |
| Immigrants | Congo | 0.3 /100 | #265 | Tragic 52.1% |
| Immigrants | France | 0.2 /100 | #266 | Tragic 52.0% |
| Immigrants | Colombia | 0.2 /100 | #267 | Tragic 52.0% |
| Pima | 0.2 /100 | #268 | Tragic 52.0% |
Demographics Similar to Brazilians by 2 or more Vehicles in Household
In terms of 2 or more vehicles in household, the demographic groups most similar to Brazilians are Immigrants from Egypt (53.8%, a difference of 0.010%), Immigrants from Eastern Africa (53.7%, a difference of 0.030%), Immigrants from Bosnia and Herzegovina (53.8%, a difference of 0.040%), Kiowa (53.9%, a difference of 0.17%), and Immigrants from Singapore (53.9%, a difference of 0.19%).
| Demographics | Rating | Rank | 2 or more Vehicles in Household |
| Immigrants | Burma/Myanmar | 7.1 /100 | #217 | Tragic 53.9% |
| Immigrants | Argentina | 6.8 /100 | #218 | Tragic 53.9% |
| South American Indians | 6.5 /100 | #219 | Tragic 53.9% |
| Taiwanese | 6.3 /100 | #220 | Tragic 53.9% |
| Immigrants | Singapore | 6.3 /100 | #221 | Tragic 53.9% |
| Kiowa | 6.2 /100 | #222 | Tragic 53.9% |
| Immigrants | Bosnia and Herzegovina | 5.5 /100 | #223 | Tragic 53.8% |
| Brazilians | 5.3 /100 | #224 | Tragic 53.8% |
| Immigrants | Egypt | 5.2 /100 | #225 | Tragic 53.8% |
| Immigrants | Eastern Africa | 5.1 /100 | #226 | Tragic 53.7% |
| Sudanese | 4.1 /100 | #227 | Tragic 53.6% |
| Alaska Natives | 3.9 /100 | #228 | Tragic 53.6% |
| Immigrants | Turkey | 3.8 /100 | #229 | Tragic 53.6% |
| Immigrants | Nepal | 3.6 /100 | #230 | Tragic 53.5% |
| Panamanians | 3.4 /100 | #231 | Tragic 53.5% |