Immigrants from Sudan vs Immigrants from Spain 2 or more Vehicles in Household
COMPARE
Immigrants from Sudan
Immigrants from Spain
2 or more Vehicles in Household
2 or more Vehicles in Household Comparison
Immigrants from Sudan
Immigrants from Spain
52.8%
2 OR MORE VEHICLES IN HOUSEHOLD
1.0/ 100
METRIC RATING
251st/ 347
METRIC RANK
50.4%
2 OR MORE VEHICLES IN HOUSEHOLD
0.0/ 100
METRIC RATING
297th/ 347
METRIC RANK
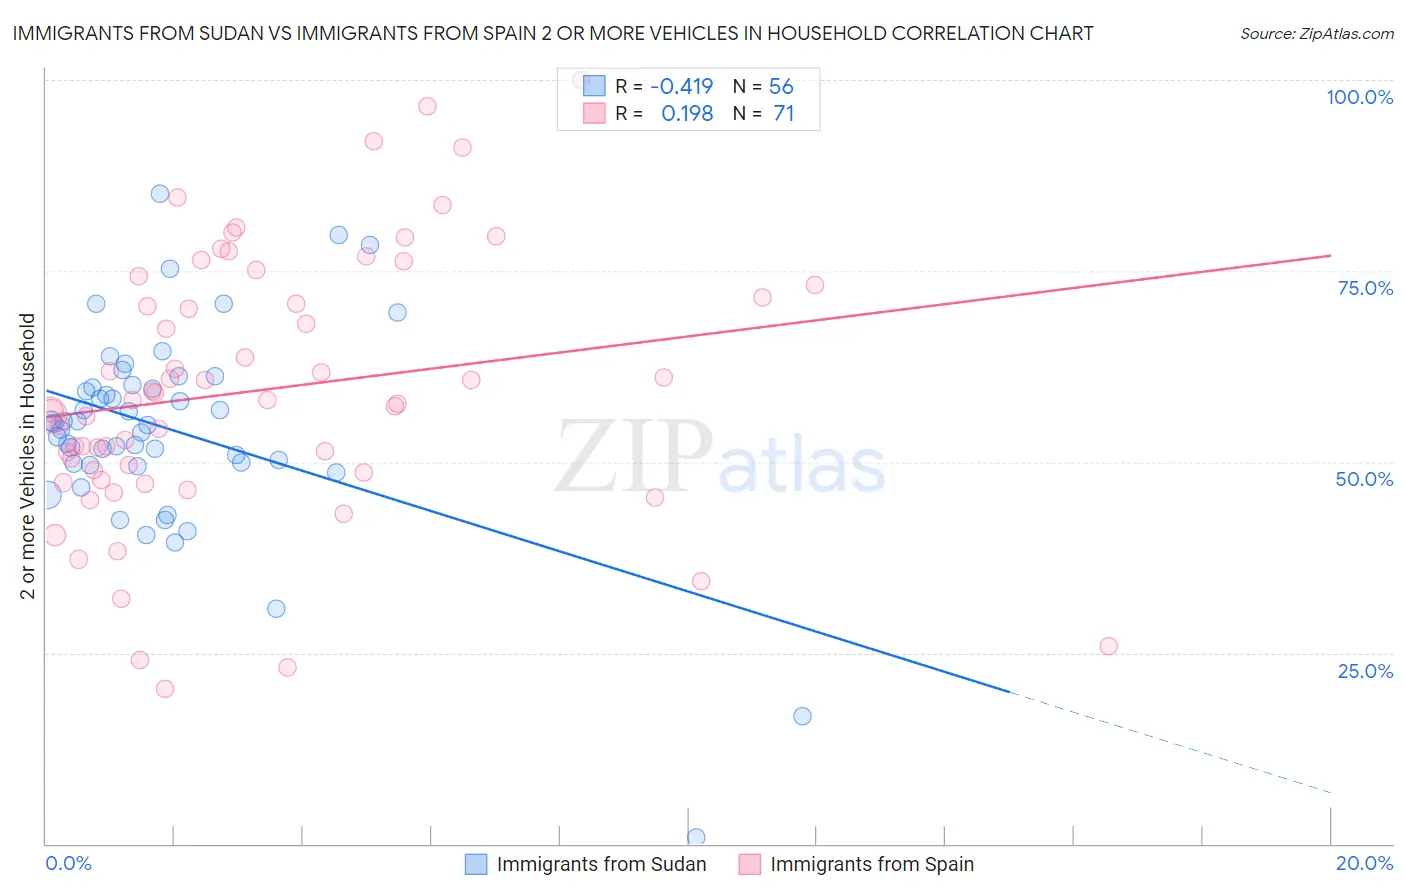
Immigrants from Sudan vs Immigrants from Spain 2 or more Vehicles in Household Correlation Chart
The statistical analysis conducted on geographies consisting of 118,954,580 people shows a moderate negative correlation between the proportion of Immigrants from Sudan and percentage of households with 2 or more vehicles available in the United States with a correlation coefficient (R) of -0.419 and weighted average of 52.8%. Similarly, the statistical analysis conducted on geographies consisting of 239,620,026 people shows a poor positive correlation between the proportion of Immigrants from Spain and percentage of households with 2 or more vehicles available in the United States with a correlation coefficient (R) of 0.198 and weighted average of 50.4%, a difference of 4.8%.
2 or more Vehicles in Household Correlation Summary
| Measurement | Immigrants from Sudan | Immigrants from Spain |
| Minimum | 0.83% | 20.3% |
| Maximum | 85.2% | 100.0% |
| Range | 84.3% | 79.7% |
| Mean | 54.2% | 59.4% |
| Median | 55.0% | 58.2% |
| Interquartile 25% (IQ1) | 49.7% | 48.7% |
| Interquartile 75% (IQ3) | 59.9% | 73.2% |
| Interquartile Range (IQR) | 10.2% | 24.6% |
| Standard Deviation (Sample) | 13.6% | 17.4% |
| Standard Deviation (Population) | 13.5% | 17.3% |
Similar Demographics by 2 or more Vehicles in Household
Demographics Similar to Immigrants from Sudan by 2 or more Vehicles in Household
In terms of 2 or more vehicles in household, the demographic groups most similar to Immigrants from Sudan are Immigrants from Portugal (52.8%, a difference of 0.010%), Mongolian (52.8%, a difference of 0.030%), Immigrants from Brazil (52.8%, a difference of 0.040%), Nigerian (52.8%, a difference of 0.060%), and Colombian (52.9%, a difference of 0.090%).
| Demographics | Rating | Rank | 2 or more Vehicles in Household |
| Indians (Asian) | 1.7 /100 | #244 | Tragic 53.1% |
| Immigrants | Ethiopia | 1.5 /100 | #245 | Tragic 53.0% |
| Immigrants | Nigeria | 1.2 /100 | #246 | Tragic 52.9% |
| Sierra Leoneans | 1.2 /100 | #247 | Tragic 52.9% |
| Colombians | 1.1 /100 | #248 | Tragic 52.9% |
| Immigrants | Brazil | 1.0 /100 | #249 | Tragic 52.8% |
| Mongolians | 1.0 /100 | #250 | Tragic 52.8% |
| Immigrants | Sudan | 1.0 /100 | #251 | Tragic 52.8% |
| Immigrants | Portugal | 1.0 /100 | #252 | Tragic 52.8% |
| Nigerians | 0.9 /100 | #253 | Tragic 52.8% |
| Immigrants | Malaysia | 0.8 /100 | #254 | Tragic 52.7% |
| Uruguayans | 0.7 /100 | #255 | Tragic 52.7% |
| Immigrants | Eritrea | 0.7 /100 | #256 | Tragic 52.6% |
| Immigrants | Hong Kong | 0.6 /100 | #257 | Tragic 52.6% |
| Central American Indians | 0.6 /100 | #258 | Tragic 52.5% |
Demographics Similar to Immigrants from Spain by 2 or more Vehicles in Household
In terms of 2 or more vehicles in household, the demographic groups most similar to Immigrants from Spain are Paraguayan (50.3%, a difference of 0.13%), Immigrants from Morocco (50.3%, a difference of 0.16%), Immigrants from Russia (50.3%, a difference of 0.20%), Immigrants from Somalia (50.5%, a difference of 0.27%), and Cypriot (50.6%, a difference of 0.31%).
| Demographics | Rating | Rank | 2 or more Vehicles in Household |
| Immigrants | Panama | 0.0 /100 | #290 | Tragic 51.1% |
| Belizeans | 0.0 /100 | #291 | Tragic 51.0% |
| Immigrants | Ukraine | 0.0 /100 | #292 | Tragic 50.9% |
| Blacks/African Americans | 0.0 /100 | #293 | Tragic 50.9% |
| Bermudans | 0.0 /100 | #294 | Tragic 50.6% |
| Cypriots | 0.0 /100 | #295 | Tragic 50.6% |
| Immigrants | Somalia | 0.0 /100 | #296 | Tragic 50.5% |
| Immigrants | Spain | 0.0 /100 | #297 | Tragic 50.4% |
| Paraguayans | 0.0 /100 | #298 | Tragic 50.3% |
| Immigrants | Morocco | 0.0 /100 | #299 | Tragic 50.3% |
| Immigrants | Russia | 0.0 /100 | #300 | Tragic 50.3% |
| Immigrants | Greece | 0.0 /100 | #301 | Tragic 50.2% |
| Immigrants | South America | 0.0 /100 | #302 | Tragic 50.2% |
| Tohono O'odham | 0.0 /100 | #303 | Tragic 50.0% |
| Immigrants | Belize | 0.0 /100 | #304 | Tragic 49.9% |