Immigrants from Sudan vs Polish 2 or more Vehicles in Household
COMPARE
Immigrants from Sudan
Polish
2 or more Vehicles in Household
2 or more Vehicles in Household Comparison
Immigrants from Sudan
Poles
52.8%
2 OR MORE VEHICLES IN HOUSEHOLD
1.0/ 100
METRIC RATING
251st/ 347
METRIC RANK
58.3%
2 OR MORE VEHICLES IN HOUSEHOLD
99.5/ 100
METRIC RATING
75th/ 347
METRIC RANK
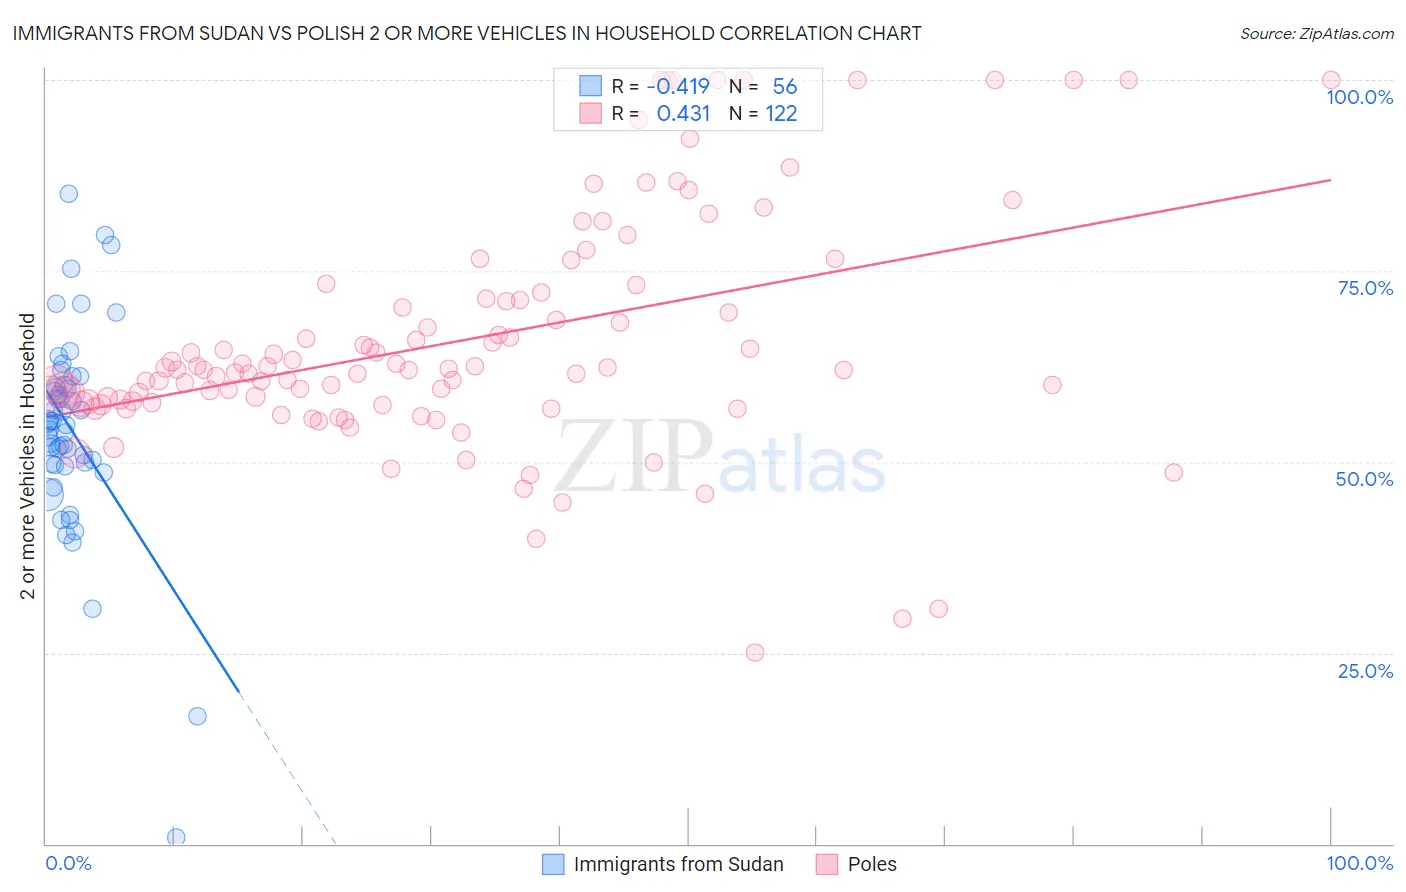
Immigrants from Sudan vs Polish 2 or more Vehicles in Household Correlation Chart
The statistical analysis conducted on geographies consisting of 118,954,580 people shows a moderate negative correlation between the proportion of Immigrants from Sudan and percentage of households with 2 or more vehicles available in the United States with a correlation coefficient (R) of -0.419 and weighted average of 52.8%. Similarly, the statistical analysis conducted on geographies consisting of 560,032,572 people shows a moderate positive correlation between the proportion of Poles and percentage of households with 2 or more vehicles available in the United States with a correlation coefficient (R) of 0.431 and weighted average of 58.3%, a difference of 10.4%.
2 or more Vehicles in Household Correlation Summary
| Measurement | Immigrants from Sudan | Polish |
| Minimum | 0.83% | 25.0% |
| Maximum | 85.2% | 100.0% |
| Range | 84.3% | 75.0% |
| Mean | 54.2% | 65.9% |
| Median | 55.0% | 62.1% |
| Interquartile 25% (IQ1) | 49.7% | 57.8% |
| Interquartile 75% (IQ3) | 59.9% | 71.3% |
| Interquartile Range (IQR) | 10.2% | 13.5% |
| Standard Deviation (Sample) | 13.6% | 15.3% |
| Standard Deviation (Population) | 13.5% | 15.3% |
Similar Demographics by 2 or more Vehicles in Household
Demographics Similar to Immigrants from Sudan by 2 or more Vehicles in Household
In terms of 2 or more vehicles in household, the demographic groups most similar to Immigrants from Sudan are Immigrants from Portugal (52.8%, a difference of 0.010%), Mongolian (52.8%, a difference of 0.030%), Immigrants from Brazil (52.8%, a difference of 0.040%), Nigerian (52.8%, a difference of 0.060%), and Colombian (52.9%, a difference of 0.090%).
| Demographics | Rating | Rank | 2 or more Vehicles in Household |
| Indians (Asian) | 1.7 /100 | #244 | Tragic 53.1% |
| Immigrants | Ethiopia | 1.5 /100 | #245 | Tragic 53.0% |
| Immigrants | Nigeria | 1.2 /100 | #246 | Tragic 52.9% |
| Sierra Leoneans | 1.2 /100 | #247 | Tragic 52.9% |
| Colombians | 1.1 /100 | #248 | Tragic 52.9% |
| Immigrants | Brazil | 1.0 /100 | #249 | Tragic 52.8% |
| Mongolians | 1.0 /100 | #250 | Tragic 52.8% |
| Immigrants | Sudan | 1.0 /100 | #251 | Tragic 52.8% |
| Immigrants | Portugal | 1.0 /100 | #252 | Tragic 52.8% |
| Nigerians | 0.9 /100 | #253 | Tragic 52.8% |
| Immigrants | Malaysia | 0.8 /100 | #254 | Tragic 52.7% |
| Uruguayans | 0.7 /100 | #255 | Tragic 52.7% |
| Immigrants | Eritrea | 0.7 /100 | #256 | Tragic 52.6% |
| Immigrants | Hong Kong | 0.6 /100 | #257 | Tragic 52.6% |
| Central American Indians | 0.6 /100 | #258 | Tragic 52.5% |
Demographics Similar to Poles by 2 or more Vehicles in Household
In terms of 2 or more vehicles in household, the demographic groups most similar to Poles are Creek (58.3%, a difference of 0.030%), Slovene (58.3%, a difference of 0.040%), Bolivian (58.3%, a difference of 0.080%), Immigrants from Afghanistan (58.3%, a difference of 0.080%), and Lithuanian (58.2%, a difference of 0.10%).
| Demographics | Rating | Rank | 2 or more Vehicles in Household |
| Canadians | 99.7 /100 | #68 | Exceptional 58.6% |
| Pennsylvania Germans | 99.7 /100 | #69 | Exceptional 58.5% |
| Italians | 99.6 /100 | #70 | Exceptional 58.4% |
| Bangladeshis | 99.6 /100 | #71 | Exceptional 58.4% |
| Austrians | 99.6 /100 | #72 | Exceptional 58.4% |
| Bolivians | 99.6 /100 | #73 | Exceptional 58.3% |
| Immigrants | Afghanistan | 99.6 /100 | #74 | Exceptional 58.3% |
| Poles | 99.5 /100 | #75 | Exceptional 58.3% |
| Creek | 99.5 /100 | #76 | Exceptional 58.3% |
| Slovenes | 99.5 /100 | #77 | Exceptional 58.3% |
| Lithuanians | 99.5 /100 | #78 | Exceptional 58.2% |
| Delaware | 99.4 /100 | #79 | Exceptional 58.2% |
| Immigrants | England | 99.3 /100 | #80 | Exceptional 58.1% |
| Immigrants | Iraq | 99.3 /100 | #81 | Exceptional 58.1% |
| Iranians | 99.3 /100 | #82 | Exceptional 58.1% |