Immigrants from Serbia vs French Canadian 3 or more Vehicles in Household
COMPARE
Immigrants from Serbia
French Canadian
3 or more Vehicles in Household
3 or more Vehicles in Household Comparison
Immigrants from Serbia
French Canadians
16.4%
3 OR MORE VEHICLES IN HOUSEHOLD
0.0/ 100
METRIC RATING
303rd/ 347
METRIC RANK
20.6%
3 OR MORE VEHICLES IN HOUSEHOLD
95.0/ 100
METRIC RATING
115th/ 347
METRIC RANK
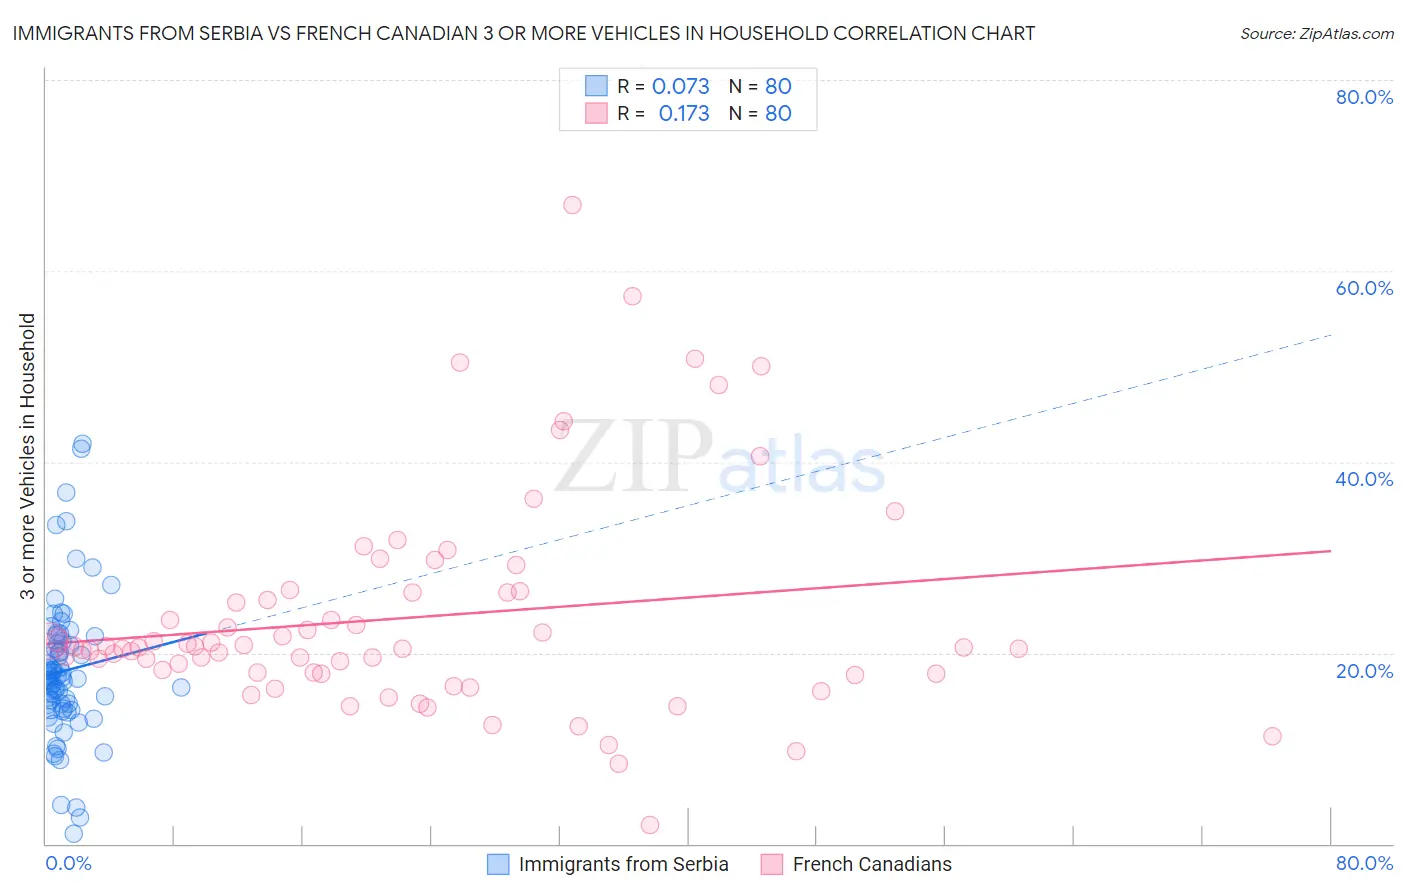
Immigrants from Serbia vs French Canadian 3 or more Vehicles in Household Correlation Chart
The statistical analysis conducted on geographies consisting of 131,699,405 people shows a slight positive correlation between the proportion of Immigrants from Serbia and percentage of households with 3 or more vehicles available in the United States with a correlation coefficient (R) of 0.073 and weighted average of 16.4%. Similarly, the statistical analysis conducted on geographies consisting of 502,103,809 people shows a poor positive correlation between the proportion of French Canadians and percentage of households with 3 or more vehicles available in the United States with a correlation coefficient (R) of 0.173 and weighted average of 20.6%, a difference of 25.3%.
3 or more Vehicles in Household Correlation Summary
| Measurement | Immigrants from Serbia | French Canadian |
| Minimum | 1.1% | 2.0% |
| Maximum | 41.9% | 66.8% |
| Range | 40.8% | 64.8% |
| Mean | 18.1% | 23.7% |
| Median | 17.4% | 20.6% |
| Interquartile 25% (IQ1) | 14.4% | 17.9% |
| Interquartile 75% (IQ3) | 21.1% | 26.4% |
| Interquartile Range (IQR) | 6.7% | 8.5% |
| Standard Deviation (Sample) | 7.4% | 11.3% |
| Standard Deviation (Population) | 7.4% | 11.3% |
Similar Demographics by 3 or more Vehicles in Household
Demographics Similar to Immigrants from Serbia by 3 or more Vehicles in Household
In terms of 3 or more vehicles in household, the demographic groups most similar to Immigrants from Serbia are Immigrants from Greece (16.5%, a difference of 0.31%), Ghanaian (16.4%, a difference of 0.47%), Paraguayan (16.6%, a difference of 0.73%), Immigrants from Morocco (16.3%, a difference of 0.74%), and Cypriot (16.6%, a difference of 1.1%).
| Demographics | Rating | Rank | 3 or more Vehicles in Household |
| Inupiat | 0.1 /100 | #296 | Tragic 16.9% |
| Israelis | 0.1 /100 | #297 | Tragic 16.8% |
| Immigrants | Zaire | 0.1 /100 | #298 | Tragic 16.7% |
| Immigrants | South America | 0.1 /100 | #299 | Tragic 16.7% |
| Cypriots | 0.0 /100 | #300 | Tragic 16.6% |
| Paraguayans | 0.0 /100 | #301 | Tragic 16.6% |
| Immigrants | Greece | 0.0 /100 | #302 | Tragic 16.5% |
| Immigrants | Serbia | 0.0 /100 | #303 | Tragic 16.4% |
| Ghanaians | 0.0 /100 | #304 | Tragic 16.4% |
| Immigrants | Morocco | 0.0 /100 | #305 | Tragic 16.3% |
| Somalis | 0.0 /100 | #306 | Tragic 16.2% |
| Immigrants | Ghana | 0.0 /100 | #307 | Tragic 16.2% |
| Houma | 0.0 /100 | #308 | Tragic 16.1% |
| Immigrants | Somalia | 0.0 /100 | #309 | Tragic 15.9% |
| Moroccans | 0.0 /100 | #310 | Tragic 15.9% |
Demographics Similar to French Canadians by 3 or more Vehicles in Household
In terms of 3 or more vehicles in household, the demographic groups most similar to French Canadians are Italian (20.6%, a difference of 0.030%), Croatian (20.6%, a difference of 0.050%), Costa Rican (20.6%, a difference of 0.16%), Immigrants from Latin America (20.5%, a difference of 0.20%), and Burmese (20.6%, a difference of 0.31%).
| Demographics | Rating | Rank | 3 or more Vehicles in Household |
| Immigrants | Scotland | 97.1 /100 | #108 | Exceptional 20.8% |
| Filipinos | 97.0 /100 | #109 | Exceptional 20.8% |
| Asians | 96.8 /100 | #110 | Exceptional 20.8% |
| Immigrants | Micronesia | 96.7 /100 | #111 | Exceptional 20.7% |
| Nicaraguans | 96.2 /100 | #112 | Exceptional 20.7% |
| Immigrants | England | 96.2 /100 | #113 | Exceptional 20.7% |
| Burmese | 95.8 /100 | #114 | Exceptional 20.6% |
| French Canadians | 95.0 /100 | #115 | Exceptional 20.6% |
| Italians | 94.9 /100 | #116 | Exceptional 20.6% |
| Croatians | 94.9 /100 | #117 | Exceptional 20.6% |
| Costa Ricans | 94.6 /100 | #118 | Exceptional 20.6% |
| Immigrants | Latin America | 94.5 /100 | #119 | Exceptional 20.5% |
| Maltese | 93.9 /100 | #120 | Exceptional 20.5% |
| Immigrants | Thailand | 93.8 /100 | #121 | Exceptional 20.5% |
| German Russians | 93.7 /100 | #122 | Exceptional 20.5% |