Immigrants from Serbia vs Navajo 3 or more Vehicles in Household
COMPARE
Immigrants from Serbia
Navajo
3 or more Vehicles in Household
3 or more Vehicles in Household Comparison
Immigrants from Serbia
Navajo
16.4%
3 OR MORE VEHICLES IN HOUSEHOLD
0.0/ 100
METRIC RATING
303rd/ 347
METRIC RANK
22.3%
3 OR MORE VEHICLES IN HOUSEHOLD
100.0/ 100
METRIC RATING
59th/ 347
METRIC RANK
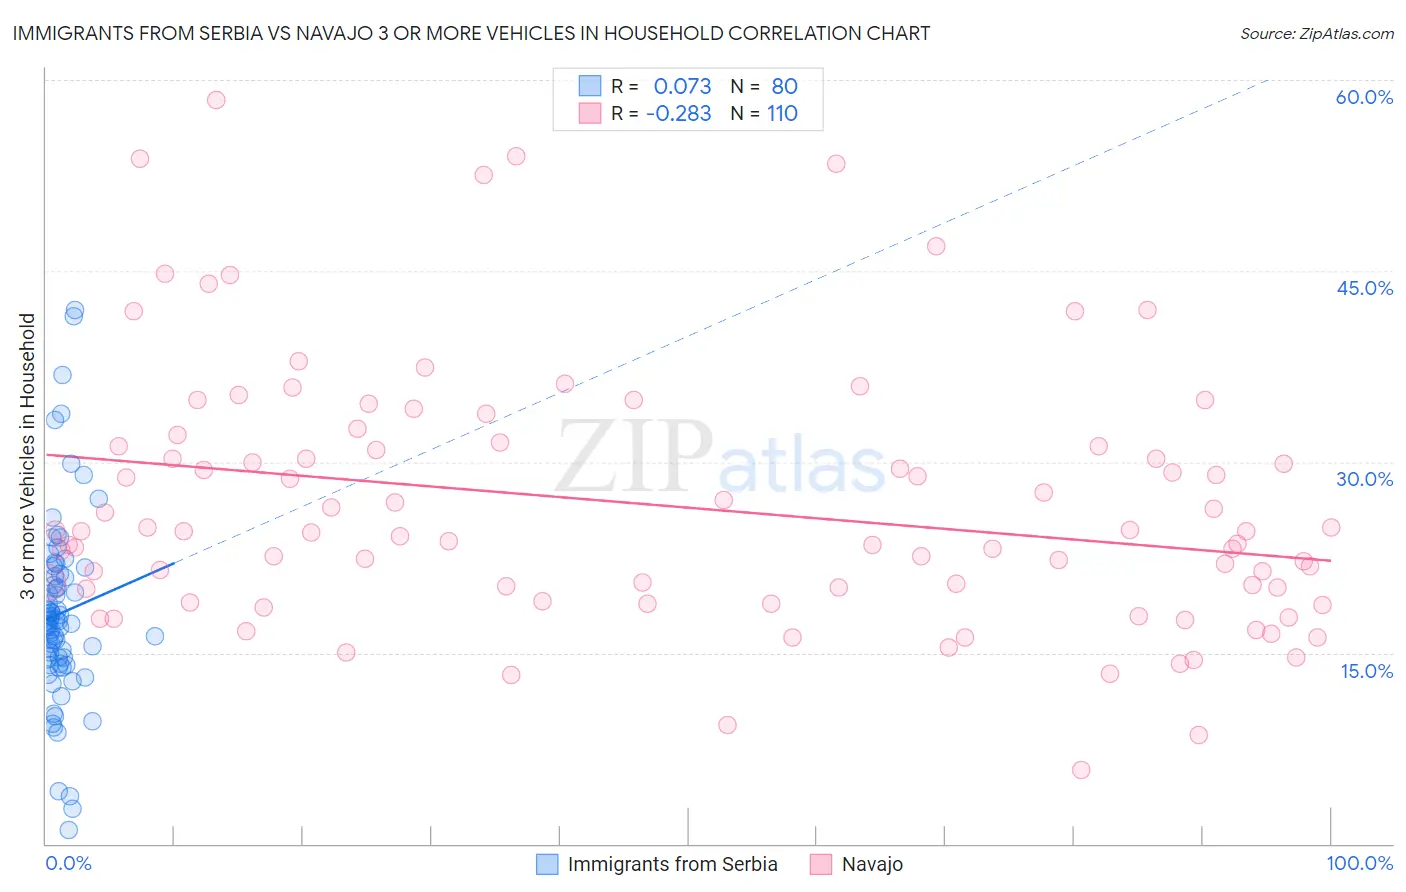
Immigrants from Serbia vs Navajo 3 or more Vehicles in Household Correlation Chart
The statistical analysis conducted on geographies consisting of 131,699,405 people shows a slight positive correlation between the proportion of Immigrants from Serbia and percentage of households with 3 or more vehicles available in the United States with a correlation coefficient (R) of 0.073 and weighted average of 16.4%. Similarly, the statistical analysis conducted on geographies consisting of 224,733,620 people shows a weak negative correlation between the proportion of Navajo and percentage of households with 3 or more vehicles available in the United States with a correlation coefficient (R) of -0.283 and weighted average of 22.3%, a difference of 35.7%.
3 or more Vehicles in Household Correlation Summary
| Measurement | Immigrants from Serbia | Navajo |
| Minimum | 1.1% | 5.8% |
| Maximum | 41.9% | 58.5% |
| Range | 40.8% | 52.7% |
| Mean | 18.1% | 26.6% |
| Median | 17.4% | 24.5% |
| Interquartile 25% (IQ1) | 14.4% | 20.0% |
| Interquartile 75% (IQ3) | 21.1% | 31.2% |
| Interquartile Range (IQR) | 6.7% | 11.2% |
| Standard Deviation (Sample) | 7.4% | 10.2% |
| Standard Deviation (Population) | 7.4% | 10.1% |
Similar Demographics by 3 or more Vehicles in Household
Demographics Similar to Immigrants from Serbia by 3 or more Vehicles in Household
In terms of 3 or more vehicles in household, the demographic groups most similar to Immigrants from Serbia are Immigrants from Greece (16.5%, a difference of 0.31%), Ghanaian (16.4%, a difference of 0.47%), Paraguayan (16.6%, a difference of 0.73%), Immigrants from Morocco (16.3%, a difference of 0.74%), and Cypriot (16.6%, a difference of 1.1%).
| Demographics | Rating | Rank | 3 or more Vehicles in Household |
| Inupiat | 0.1 /100 | #296 | Tragic 16.9% |
| Israelis | 0.1 /100 | #297 | Tragic 16.8% |
| Immigrants | Zaire | 0.1 /100 | #298 | Tragic 16.7% |
| Immigrants | South America | 0.1 /100 | #299 | Tragic 16.7% |
| Cypriots | 0.0 /100 | #300 | Tragic 16.6% |
| Paraguayans | 0.0 /100 | #301 | Tragic 16.6% |
| Immigrants | Greece | 0.0 /100 | #302 | Tragic 16.5% |
| Immigrants | Serbia | 0.0 /100 | #303 | Tragic 16.4% |
| Ghanaians | 0.0 /100 | #304 | Tragic 16.4% |
| Immigrants | Morocco | 0.0 /100 | #305 | Tragic 16.3% |
| Somalis | 0.0 /100 | #306 | Tragic 16.2% |
| Immigrants | Ghana | 0.0 /100 | #307 | Tragic 16.2% |
| Houma | 0.0 /100 | #308 | Tragic 16.1% |
| Immigrants | Somalia | 0.0 /100 | #309 | Tragic 15.9% |
| Moroccans | 0.0 /100 | #310 | Tragic 15.9% |
Demographics Similar to Navajo by 3 or more Vehicles in Household
In terms of 3 or more vehicles in household, the demographic groups most similar to Navajo are Spaniard (22.3%, a difference of 0.060%), Finnish (22.3%, a difference of 0.090%), Pennsylvania German (22.3%, a difference of 0.19%), Bhutanese (22.2%, a difference of 0.24%), and Fijian (22.2%, a difference of 0.28%).
| Demographics | Rating | Rank | 3 or more Vehicles in Household |
| Welsh | 100.0 /100 | #52 | Exceptional 22.6% |
| Czechs | 100.0 /100 | #53 | Exceptional 22.5% |
| Crow | 100.0 /100 | #54 | Exceptional 22.5% |
| Immigrants | Laos | 100.0 /100 | #55 | Exceptional 22.4% |
| Hispanics or Latinos | 100.0 /100 | #56 | Exceptional 22.4% |
| Pennsylvania Germans | 100.0 /100 | #57 | Exceptional 22.3% |
| Spaniards | 100.0 /100 | #58 | Exceptional 22.3% |
| Navajo | 100.0 /100 | #59 | Exceptional 22.3% |
| Finns | 99.9 /100 | #60 | Exceptional 22.3% |
| Bhutanese | 99.9 /100 | #61 | Exceptional 22.2% |
| Fijians | 99.9 /100 | #62 | Exceptional 22.2% |
| Chickasaw | 99.9 /100 | #63 | Exceptional 22.2% |
| Immigrants | Taiwan | 99.9 /100 | #64 | Exceptional 22.1% |
| Pima | 99.9 /100 | #65 | Exceptional 22.0% |
| Northern Europeans | 99.9 /100 | #66 | Exceptional 22.0% |