Immigrants from Saudi Arabia vs Cheyenne 3 or more Vehicles in Household
COMPARE
Immigrants from Saudi Arabia
Cheyenne
3 or more Vehicles in Household
3 or more Vehicles in Household Comparison
Immigrants from Saudi Arabia
Cheyenne
18.0%
3 OR MORE VEHICLES IN HOUSEHOLD
1.7/ 100
METRIC RATING
249th/ 347
METRIC RANK
22.7%
3 OR MORE VEHICLES IN HOUSEHOLD
100.0/ 100
METRIC RATING
44th/ 347
METRIC RANK
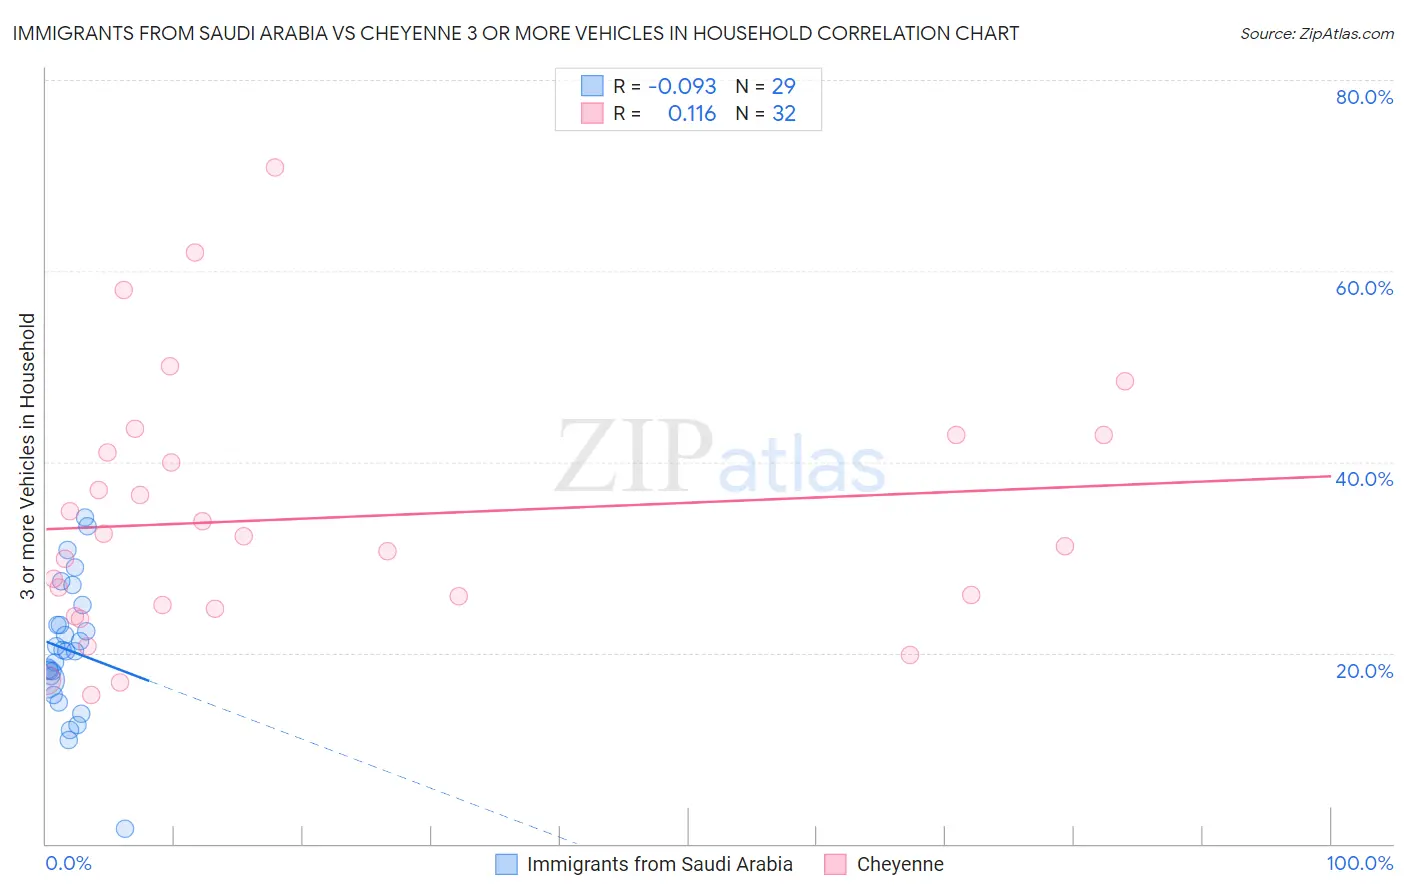
Immigrants from Saudi Arabia vs Cheyenne 3 or more Vehicles in Household Correlation Chart
The statistical analysis conducted on geographies consisting of 164,148,473 people shows a slight negative correlation between the proportion of Immigrants from Saudi Arabia and percentage of households with 3 or more vehicles available in the United States with a correlation coefficient (R) of -0.093 and weighted average of 18.0%. Similarly, the statistical analysis conducted on geographies consisting of 80,705,917 people shows a poor positive correlation between the proportion of Cheyenne and percentage of households with 3 or more vehicles available in the United States with a correlation coefficient (R) of 0.116 and weighted average of 22.7%, a difference of 26.0%.
3 or more Vehicles in Household Correlation Summary
| Measurement | Immigrants from Saudi Arabia | Cheyenne |
| Minimum | 1.5% | 15.6% |
| Maximum | 34.2% | 70.8% |
| Range | 32.7% | 55.2% |
| Mean | 20.3% | 34.1% |
| Median | 20.2% | 31.7% |
| Interquartile 25% (IQ1) | 16.4% | 24.8% |
| Interquartile 75% (IQ3) | 24.0% | 41.9% |
| Interquartile Range (IQR) | 7.7% | 17.1% |
| Standard Deviation (Sample) | 7.1% | 13.3% |
| Standard Deviation (Population) | 6.9% | 13.1% |
Similar Demographics by 3 or more Vehicles in Household
Demographics Similar to Immigrants from Saudi Arabia by 3 or more Vehicles in Household
In terms of 3 or more vehicles in household, the demographic groups most similar to Immigrants from Saudi Arabia are Venezuelan (18.0%, a difference of 0.020%), Immigrants from Eastern Africa (18.0%, a difference of 0.060%), Carpatho Rusyn (18.0%, a difference of 0.19%), Alsatian (18.0%, a difference of 0.22%), and Immigrants from Australia (18.1%, a difference of 0.35%).
| Demographics | Rating | Rank | 3 or more Vehicles in Household |
| Hopi | 2.5 /100 | #242 | Tragic 18.2% |
| Immigrants | Europe | 2.4 /100 | #243 | Tragic 18.1% |
| Mongolians | 2.3 /100 | #244 | Tragic 18.1% |
| Immigrants | Belize | 2.1 /100 | #245 | Tragic 18.1% |
| Immigrants | Australia | 2.0 /100 | #246 | Tragic 18.1% |
| Carpatho Rusyns | 1.9 /100 | #247 | Tragic 18.0% |
| Immigrants | Eastern Africa | 1.8 /100 | #248 | Tragic 18.0% |
| Immigrants | Saudi Arabia | 1.7 /100 | #249 | Tragic 18.0% |
| Venezuelans | 1.7 /100 | #250 | Tragic 18.0% |
| Alsatians | 1.5 /100 | #251 | Tragic 18.0% |
| Immigrants | Southern Europe | 1.4 /100 | #252 | Tragic 17.9% |
| Immigrants | Ethiopia | 1.3 /100 | #253 | Tragic 17.9% |
| Ethiopians | 1.2 /100 | #254 | Tragic 17.9% |
| Immigrants | Turkey | 1.2 /100 | #255 | Tragic 17.9% |
| Sub-Saharan Africans | 1.1 /100 | #256 | Tragic 17.9% |
Demographics Similar to Cheyenne by 3 or more Vehicles in Household
In terms of 3 or more vehicles in household, the demographic groups most similar to Cheyenne are Ute (22.7%, a difference of 0.10%), Osage (22.7%, a difference of 0.13%), German (22.7%, a difference of 0.25%), Native/Alaskan (22.7%, a difference of 0.25%), and American (22.6%, a difference of 0.29%).
| Demographics | Rating | Rank | 3 or more Vehicles in Household |
| Swedes | 100.0 /100 | #37 | Exceptional 23.0% |
| Dutch | 100.0 /100 | #38 | Exceptional 22.9% |
| Yaqui | 100.0 /100 | #39 | Exceptional 22.9% |
| Europeans | 100.0 /100 | #40 | Exceptional 22.9% |
| Germans | 100.0 /100 | #41 | Exceptional 22.7% |
| Natives/Alaskans | 100.0 /100 | #42 | Exceptional 22.7% |
| Osage | 100.0 /100 | #43 | Exceptional 22.7% |
| Cheyenne | 100.0 /100 | #44 | Exceptional 22.7% |
| Ute | 100.0 /100 | #45 | Exceptional 22.7% |
| Americans | 100.0 /100 | #46 | Exceptional 22.6% |
| Malaysians | 100.0 /100 | #47 | Exceptional 22.6% |
| Scottish | 100.0 /100 | #48 | Exceptional 22.6% |
| Scotch-Irish | 100.0 /100 | #49 | Exceptional 22.6% |
| Sioux | 100.0 /100 | #50 | Exceptional 22.6% |
| Whites/Caucasians | 100.0 /100 | #51 | Exceptional 22.6% |