Immigrants from Albania vs Cheyenne 3 or more Vehicles in Household
COMPARE
Immigrants from Albania
Cheyenne
3 or more Vehicles in Household
3 or more Vehicles in Household Comparison
Immigrants from Albania
Cheyenne
14.0%
3 OR MORE VEHICLES IN HOUSEHOLD
0.0/ 100
METRIC RATING
328th/ 347
METRIC RANK
22.7%
3 OR MORE VEHICLES IN HOUSEHOLD
100.0/ 100
METRIC RATING
44th/ 347
METRIC RANK
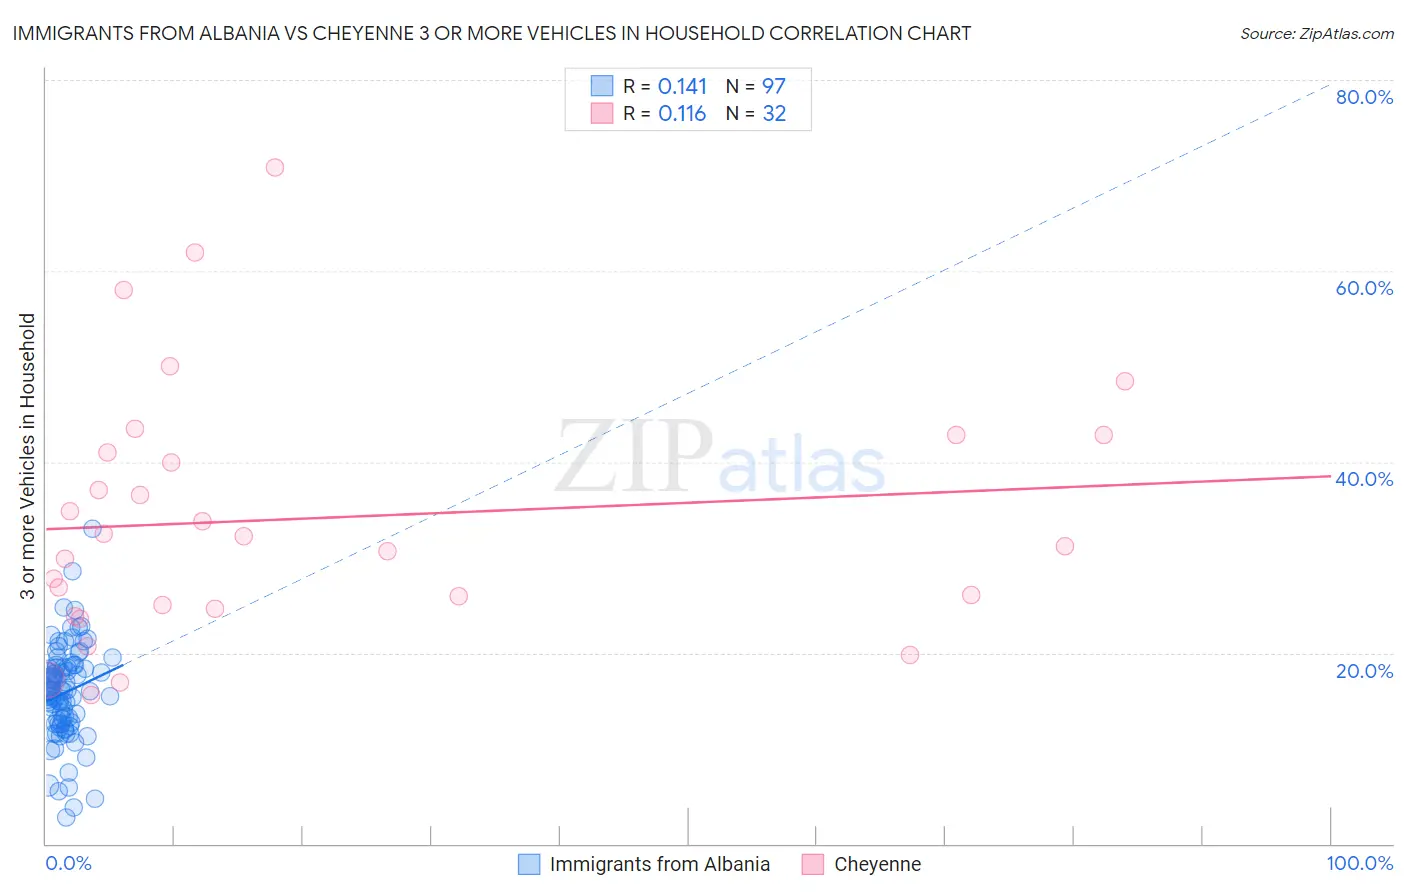
Immigrants from Albania vs Cheyenne 3 or more Vehicles in Household Correlation Chart
The statistical analysis conducted on geographies consisting of 119,328,731 people shows a poor positive correlation between the proportion of Immigrants from Albania and percentage of households with 3 or more vehicles available in the United States with a correlation coefficient (R) of 0.141 and weighted average of 14.0%. Similarly, the statistical analysis conducted on geographies consisting of 80,705,917 people shows a poor positive correlation between the proportion of Cheyenne and percentage of households with 3 or more vehicles available in the United States with a correlation coefficient (R) of 0.116 and weighted average of 22.7%, a difference of 62.6%.
3 or more Vehicles in Household Correlation Summary
| Measurement | Immigrants from Albania | Cheyenne |
| Minimum | 2.7% | 15.6% |
| Maximum | 33.0% | 70.8% |
| Range | 30.3% | 55.2% |
| Mean | 15.8% | 34.1% |
| Median | 16.1% | 31.7% |
| Interquartile 25% (IQ1) | 12.6% | 24.8% |
| Interquartile 75% (IQ3) | 18.4% | 41.9% |
| Interquartile Range (IQR) | 5.8% | 17.1% |
| Standard Deviation (Sample) | 5.0% | 13.3% |
| Standard Deviation (Population) | 5.0% | 13.1% |
Similar Demographics by 3 or more Vehicles in Household
Demographics Similar to Immigrants from Albania by 3 or more Vehicles in Household
In terms of 3 or more vehicles in household, the demographic groups most similar to Immigrants from Albania are Ecuadorian (14.1%, a difference of 0.71%), Immigrants from Senegal (13.8%, a difference of 1.2%), West Indian (13.7%, a difference of 1.5%), Soviet Union (14.2%, a difference of 1.6%), and Immigrants from Dominica (13.7%, a difference of 1.7%).
| Demographics | Rating | Rank | 3 or more Vehicles in Household |
| Immigrants | Jamaica | 0.0 /100 | #321 | Tragic 14.7% |
| Immigrants | West Indies | 0.0 /100 | #322 | Tragic 14.6% |
| Immigrants | Caribbean | 0.0 /100 | #323 | Tragic 14.6% |
| Immigrants | Yemen | 0.0 /100 | #324 | Tragic 14.2% |
| Senegalese | 0.0 /100 | #325 | Tragic 14.2% |
| Soviet Union | 0.0 /100 | #326 | Tragic 14.2% |
| Ecuadorians | 0.0 /100 | #327 | Tragic 14.1% |
| Immigrants | Albania | 0.0 /100 | #328 | Tragic 14.0% |
| Immigrants | Senegal | 0.0 /100 | #329 | Tragic 13.8% |
| West Indians | 0.0 /100 | #330 | Tragic 13.7% |
| Immigrants | Dominica | 0.0 /100 | #331 | Tragic 13.7% |
| Trinidadians and Tobagonians | 0.0 /100 | #332 | Tragic 13.6% |
| Immigrants | Cabo Verde | 0.0 /100 | #333 | Tragic 13.6% |
| Immigrants | Ecuador | 0.0 /100 | #334 | Tragic 13.4% |
| Immigrants | Trinidad and Tobago | 0.0 /100 | #335 | Tragic 13.3% |
Demographics Similar to Cheyenne by 3 or more Vehicles in Household
In terms of 3 or more vehicles in household, the demographic groups most similar to Cheyenne are Ute (22.7%, a difference of 0.10%), Osage (22.7%, a difference of 0.13%), German (22.7%, a difference of 0.25%), Native/Alaskan (22.7%, a difference of 0.25%), and American (22.6%, a difference of 0.29%).
| Demographics | Rating | Rank | 3 or more Vehicles in Household |
| Swedes | 100.0 /100 | #37 | Exceptional 23.0% |
| Dutch | 100.0 /100 | #38 | Exceptional 22.9% |
| Yaqui | 100.0 /100 | #39 | Exceptional 22.9% |
| Europeans | 100.0 /100 | #40 | Exceptional 22.9% |
| Germans | 100.0 /100 | #41 | Exceptional 22.7% |
| Natives/Alaskans | 100.0 /100 | #42 | Exceptional 22.7% |
| Osage | 100.0 /100 | #43 | Exceptional 22.7% |
| Cheyenne | 100.0 /100 | #44 | Exceptional 22.7% |
| Ute | 100.0 /100 | #45 | Exceptional 22.7% |
| Americans | 100.0 /100 | #46 | Exceptional 22.6% |
| Malaysians | 100.0 /100 | #47 | Exceptional 22.6% |
| Scottish | 100.0 /100 | #48 | Exceptional 22.6% |
| Scotch-Irish | 100.0 /100 | #49 | Exceptional 22.6% |
| Sioux | 100.0 /100 | #50 | Exceptional 22.6% |
| Whites/Caucasians | 100.0 /100 | #51 | Exceptional 22.6% |