Immigrants from Netherlands vs Cheyenne 3 or more Vehicles in Household
COMPARE
Immigrants from Netherlands
Cheyenne
3 or more Vehicles in Household
3 or more Vehicles in Household Comparison
Immigrants from Netherlands
Cheyenne
20.4%
3 OR MORE VEHICLES IN HOUSEHOLD
92.9/ 100
METRIC RATING
125th/ 347
METRIC RANK
22.7%
3 OR MORE VEHICLES IN HOUSEHOLD
100.0/ 100
METRIC RATING
44th/ 347
METRIC RANK
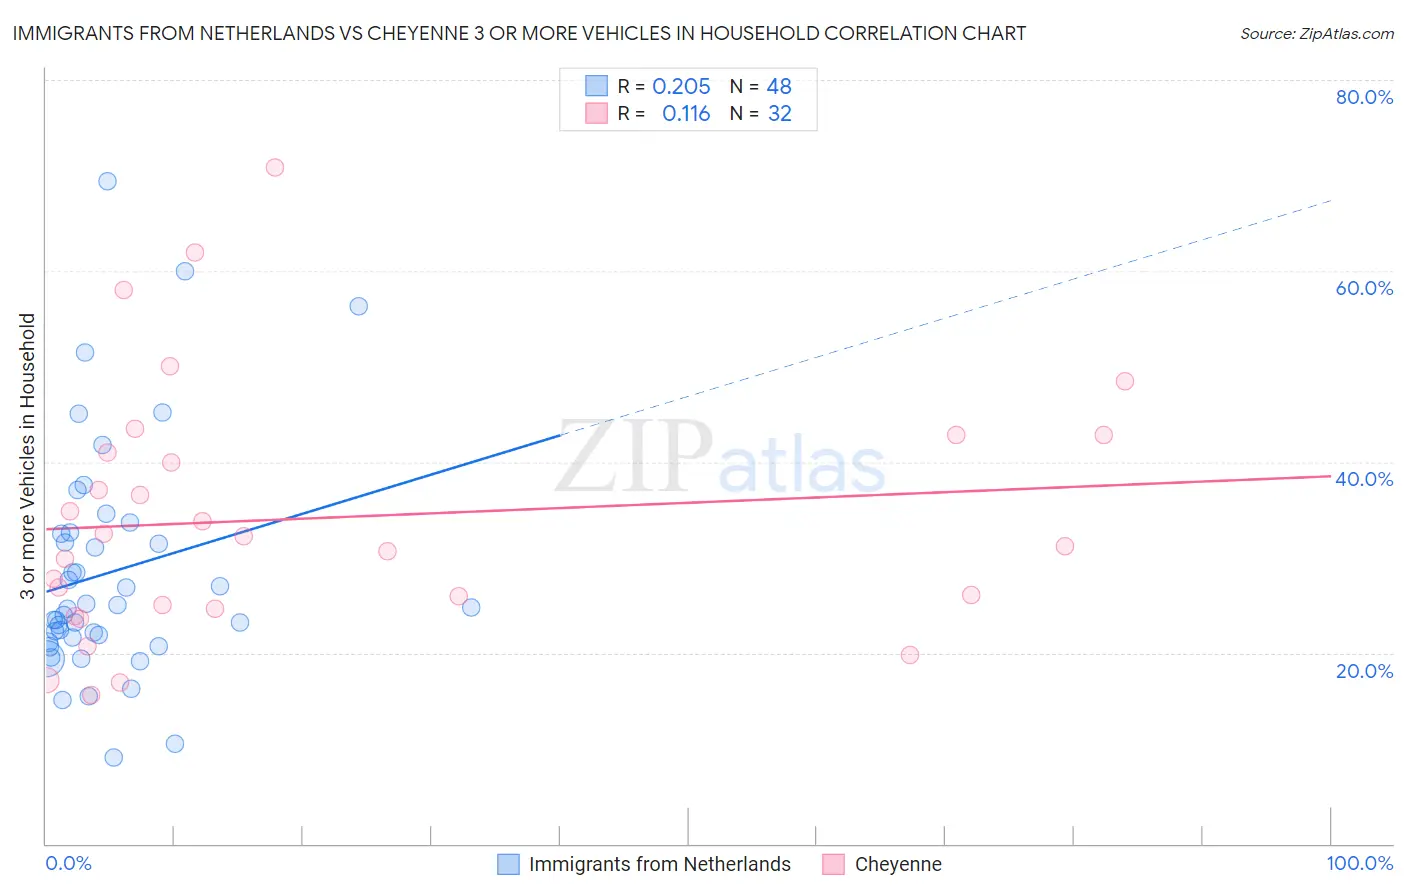
Immigrants from Netherlands vs Cheyenne 3 or more Vehicles in Household Correlation Chart
The statistical analysis conducted on geographies consisting of 237,758,469 people shows a weak positive correlation between the proportion of Immigrants from Netherlands and percentage of households with 3 or more vehicles available in the United States with a correlation coefficient (R) of 0.205 and weighted average of 20.4%. Similarly, the statistical analysis conducted on geographies consisting of 80,705,917 people shows a poor positive correlation between the proportion of Cheyenne and percentage of households with 3 or more vehicles available in the United States with a correlation coefficient (R) of 0.116 and weighted average of 22.7%, a difference of 11.0%.
3 or more Vehicles in Household Correlation Summary
| Measurement | Immigrants from Netherlands | Cheyenne |
| Minimum | 9.0% | 15.6% |
| Maximum | 69.4% | 70.8% |
| Range | 60.4% | 55.2% |
| Mean | 28.4% | 34.1% |
| Median | 24.7% | 31.7% |
| Interquartile 25% (IQ1) | 21.4% | 24.8% |
| Interquartile 75% (IQ3) | 32.5% | 41.9% |
| Interquartile Range (IQR) | 11.2% | 17.1% |
| Standard Deviation (Sample) | 12.3% | 13.3% |
| Standard Deviation (Population) | 12.2% | 13.1% |
Similar Demographics by 3 or more Vehicles in Household
Demographics Similar to Immigrants from Netherlands by 3 or more Vehicles in Household
In terms of 3 or more vehicles in household, the demographic groups most similar to Immigrants from Netherlands are Central American (20.5%, a difference of 0.030%), Immigrants from Korea (20.5%, a difference of 0.20%), German Russian (20.5%, a difference of 0.21%), Slavic (20.4%, a difference of 0.21%), and Immigrants from Thailand (20.5%, a difference of 0.25%).
| Demographics | Rating | Rank | 3 or more Vehicles in Household |
| Costa Ricans | 94.6 /100 | #118 | Exceptional 20.6% |
| Immigrants | Latin America | 94.5 /100 | #119 | Exceptional 20.5% |
| Maltese | 93.9 /100 | #120 | Exceptional 20.5% |
| Immigrants | Thailand | 93.8 /100 | #121 | Exceptional 20.5% |
| German Russians | 93.7 /100 | #122 | Exceptional 20.5% |
| Immigrants | Korea | 93.7 /100 | #123 | Exceptional 20.5% |
| Central Americans | 93.1 /100 | #124 | Exceptional 20.5% |
| Immigrants | Netherlands | 92.9 /100 | #125 | Exceptional 20.4% |
| Slavs | 92.1 /100 | #126 | Exceptional 20.4% |
| Immigrants | Bolivia | 92.0 /100 | #127 | Exceptional 20.4% |
| New Zealanders | 91.3 /100 | #128 | Exceptional 20.4% |
| Zimbabweans | 88.7 /100 | #129 | Excellent 20.3% |
| Greeks | 88.6 /100 | #130 | Excellent 20.3% |
| Immigrants | Asia | 88.1 /100 | #131 | Excellent 20.2% |
| Immigrants | Canada | 87.8 /100 | #132 | Excellent 20.2% |
Demographics Similar to Cheyenne by 3 or more Vehicles in Household
In terms of 3 or more vehicles in household, the demographic groups most similar to Cheyenne are Ute (22.7%, a difference of 0.10%), Osage (22.7%, a difference of 0.13%), German (22.7%, a difference of 0.25%), Native/Alaskan (22.7%, a difference of 0.25%), and American (22.6%, a difference of 0.29%).
| Demographics | Rating | Rank | 3 or more Vehicles in Household |
| Swedes | 100.0 /100 | #37 | Exceptional 23.0% |
| Dutch | 100.0 /100 | #38 | Exceptional 22.9% |
| Yaqui | 100.0 /100 | #39 | Exceptional 22.9% |
| Europeans | 100.0 /100 | #40 | Exceptional 22.9% |
| Germans | 100.0 /100 | #41 | Exceptional 22.7% |
| Natives/Alaskans | 100.0 /100 | #42 | Exceptional 22.7% |
| Osage | 100.0 /100 | #43 | Exceptional 22.7% |
| Cheyenne | 100.0 /100 | #44 | Exceptional 22.7% |
| Ute | 100.0 /100 | #45 | Exceptional 22.7% |
| Americans | 100.0 /100 | #46 | Exceptional 22.6% |
| Malaysians | 100.0 /100 | #47 | Exceptional 22.6% |
| Scottish | 100.0 /100 | #48 | Exceptional 22.6% |
| Scotch-Irish | 100.0 /100 | #49 | Exceptional 22.6% |
| Sioux | 100.0 /100 | #50 | Exceptional 22.6% |
| Whites/Caucasians | 100.0 /100 | #51 | Exceptional 22.6% |