Taiwanese vs Cheyenne 3 or more Vehicles in Household
COMPARE
Taiwanese
Cheyenne
3 or more Vehicles in Household
3 or more Vehicles in Household Comparison
Taiwanese
Cheyenne
20.0%
3 OR MORE VEHICLES IN HOUSEHOLD
80.6/ 100
METRIC RATING
151st/ 347
METRIC RANK
22.7%
3 OR MORE VEHICLES IN HOUSEHOLD
100.0/ 100
METRIC RATING
44th/ 347
METRIC RANK
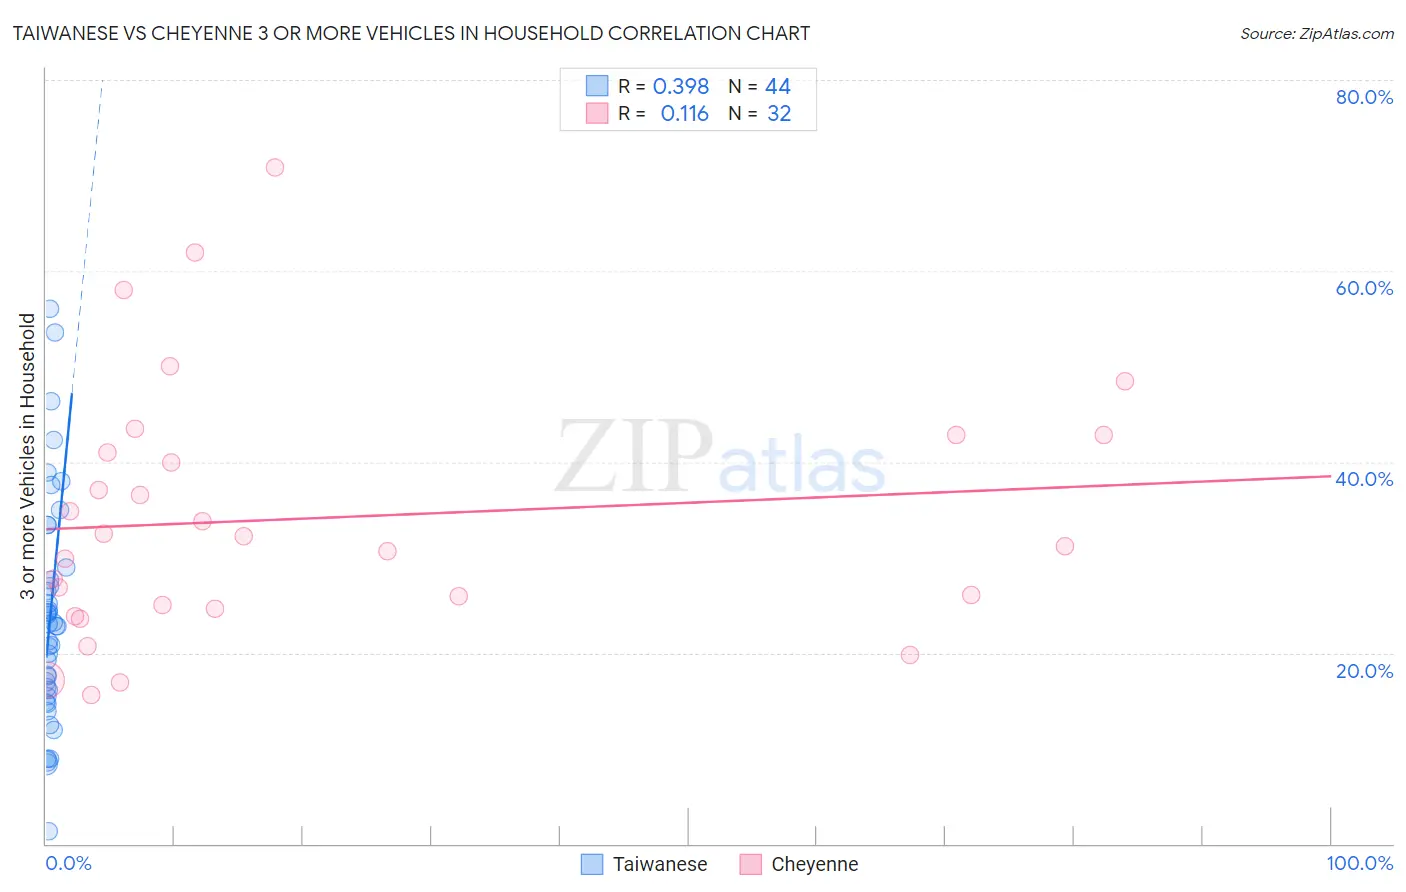
Taiwanese vs Cheyenne 3 or more Vehicles in Household Correlation Chart
The statistical analysis conducted on geographies consisting of 31,709,765 people shows a mild positive correlation between the proportion of Taiwanese and percentage of households with 3 or more vehicles available in the United States with a correlation coefficient (R) of 0.398 and weighted average of 20.0%. Similarly, the statistical analysis conducted on geographies consisting of 80,705,917 people shows a poor positive correlation between the proportion of Cheyenne and percentage of households with 3 or more vehicles available in the United States with a correlation coefficient (R) of 0.116 and weighted average of 22.7%, a difference of 13.3%.
3 or more Vehicles in Household Correlation Summary
| Measurement | Taiwanese | Cheyenne |
| Minimum | 1.3% | 15.6% |
| Maximum | 56.1% | 70.8% |
| Range | 54.8% | 55.2% |
| Mean | 23.7% | 34.1% |
| Median | 22.7% | 31.7% |
| Interquartile 25% (IQ1) | 15.8% | 24.8% |
| Interquartile 75% (IQ3) | 28.3% | 41.9% |
| Interquartile Range (IQR) | 12.5% | 17.1% |
| Standard Deviation (Sample) | 11.9% | 13.3% |
| Standard Deviation (Population) | 11.8% | 13.1% |
Similar Demographics by 3 or more Vehicles in Household
Demographics Similar to Taiwanese by 3 or more Vehicles in Household
In terms of 3 or more vehicles in household, the demographic groups most similar to Taiwanese are Immigrants (20.0%, a difference of 0.020%), Immigrants from Iran (20.0%, a difference of 0.030%), Lebanese (20.0%, a difference of 0.10%), Guatemalan (20.1%, a difference of 0.24%), and Slovak (20.1%, a difference of 0.29%).
| Demographics | Rating | Rank | 3 or more Vehicles in Household |
| Iranians | 84.0 /100 | #144 | Excellent 20.1% |
| Palestinians | 83.9 /100 | #145 | Excellent 20.1% |
| Australians | 83.6 /100 | #146 | Excellent 20.1% |
| Slovaks | 83.0 /100 | #147 | Excellent 20.1% |
| Guatemalans | 82.6 /100 | #148 | Excellent 20.1% |
| Immigrants | Iran | 80.9 /100 | #149 | Excellent 20.0% |
| Immigrants | Immigrants | 80.8 /100 | #150 | Excellent 20.0% |
| Taiwanese | 80.6 /100 | #151 | Excellent 20.0% |
| Lebanese | 79.8 /100 | #152 | Good 20.0% |
| Yuman | 75.6 /100 | #153 | Good 19.9% |
| Immigrants | Jordan | 75.0 /100 | #154 | Good 19.9% |
| Tlingit-Haida | 73.4 /100 | #155 | Good 19.9% |
| Thais | 71.1 /100 | #156 | Good 19.8% |
| Hungarians | 70.5 /100 | #157 | Good 19.8% |
| Armenians | 68.8 /100 | #158 | Good 19.8% |
Demographics Similar to Cheyenne by 3 or more Vehicles in Household
In terms of 3 or more vehicles in household, the demographic groups most similar to Cheyenne are Ute (22.7%, a difference of 0.10%), Osage (22.7%, a difference of 0.13%), German (22.7%, a difference of 0.25%), Native/Alaskan (22.7%, a difference of 0.25%), and American (22.6%, a difference of 0.29%).
| Demographics | Rating | Rank | 3 or more Vehicles in Household |
| Swedes | 100.0 /100 | #37 | Exceptional 23.0% |
| Dutch | 100.0 /100 | #38 | Exceptional 22.9% |
| Yaqui | 100.0 /100 | #39 | Exceptional 22.9% |
| Europeans | 100.0 /100 | #40 | Exceptional 22.9% |
| Germans | 100.0 /100 | #41 | Exceptional 22.7% |
| Natives/Alaskans | 100.0 /100 | #42 | Exceptional 22.7% |
| Osage | 100.0 /100 | #43 | Exceptional 22.7% |
| Cheyenne | 100.0 /100 | #44 | Exceptional 22.7% |
| Ute | 100.0 /100 | #45 | Exceptional 22.7% |
| Americans | 100.0 /100 | #46 | Exceptional 22.6% |
| Malaysians | 100.0 /100 | #47 | Exceptional 22.6% |
| Scottish | 100.0 /100 | #48 | Exceptional 22.6% |
| Scotch-Irish | 100.0 /100 | #49 | Exceptional 22.6% |
| Sioux | 100.0 /100 | #50 | Exceptional 22.6% |
| Whites/Caucasians | 100.0 /100 | #51 | Exceptional 22.6% |