Immigrants from Saudi Arabia vs Immigrants from Zimbabwe 3 or more Vehicles in Household
COMPARE
Immigrants from Saudi Arabia
Immigrants from Zimbabwe
3 or more Vehicles in Household
3 or more Vehicles in Household Comparison
Immigrants from Saudi Arabia
Immigrants from Zimbabwe
18.0%
3 OR MORE VEHICLES IN HOUSEHOLD
1.7/ 100
METRIC RATING
249th/ 347
METRIC RANK
19.1%
3 OR MORE VEHICLES IN HOUSEHOLD
25.5/ 100
METRIC RATING
190th/ 347
METRIC RANK
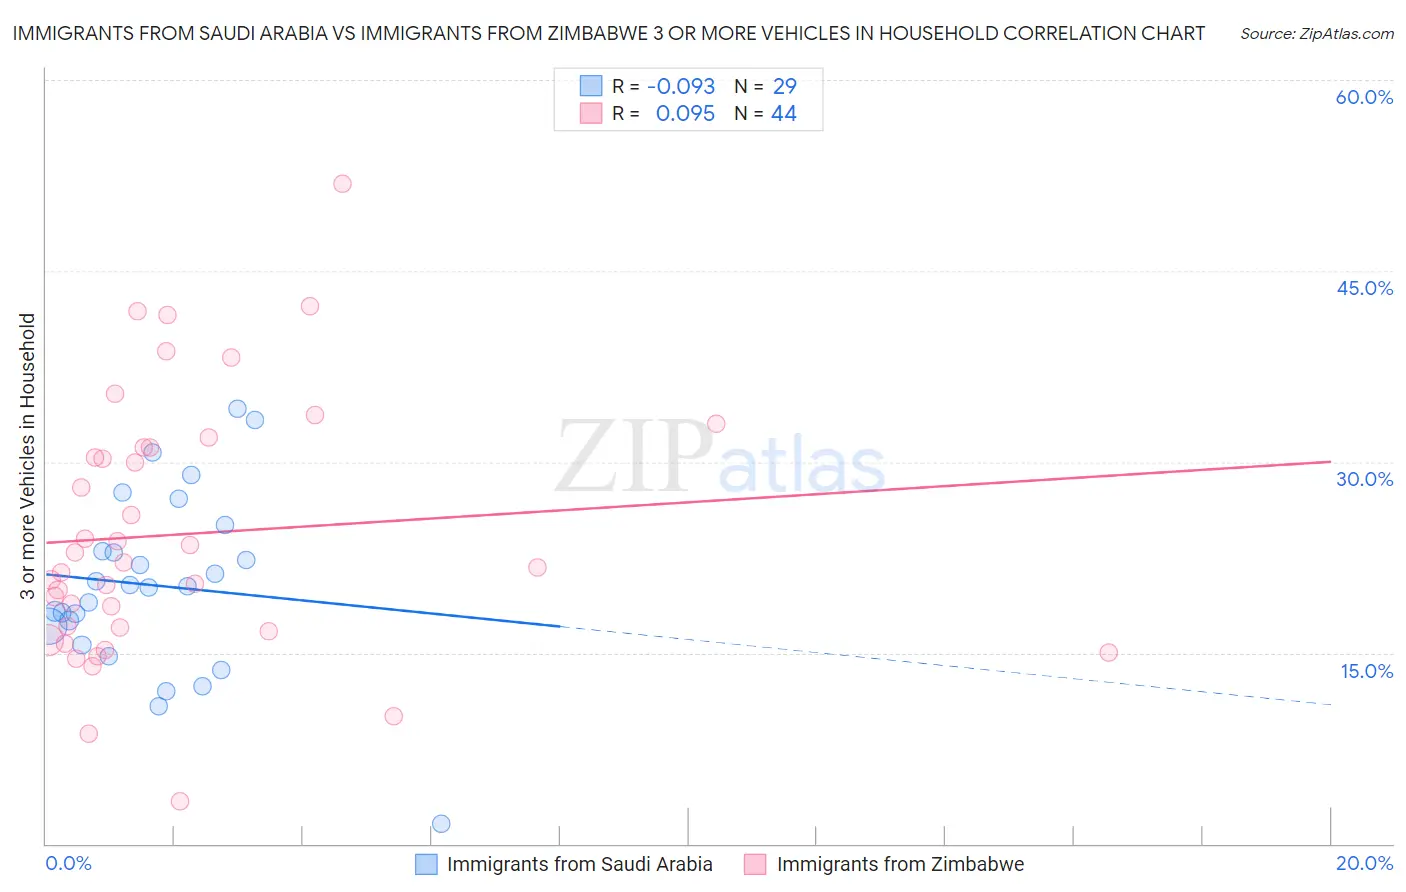
Immigrants from Saudi Arabia vs Immigrants from Zimbabwe 3 or more Vehicles in Household Correlation Chart
The statistical analysis conducted on geographies consisting of 164,148,473 people shows a slight negative correlation between the proportion of Immigrants from Saudi Arabia and percentage of households with 3 or more vehicles available in the United States with a correlation coefficient (R) of -0.093 and weighted average of 18.0%. Similarly, the statistical analysis conducted on geographies consisting of 117,785,307 people shows a slight positive correlation between the proportion of Immigrants from Zimbabwe and percentage of households with 3 or more vehicles available in the United States with a correlation coefficient (R) of 0.095 and weighted average of 19.1%, a difference of 6.1%.
3 or more Vehicles in Household Correlation Summary
| Measurement | Immigrants from Saudi Arabia | Immigrants from Zimbabwe |
| Minimum | 1.5% | 3.3% |
| Maximum | 34.2% | 51.9% |
| Range | 32.7% | 48.5% |
| Mean | 20.3% | 24.3% |
| Median | 20.2% | 21.9% |
| Interquartile 25% (IQ1) | 16.4% | 16.8% |
| Interquartile 75% (IQ3) | 24.0% | 31.1% |
| Interquartile Range (IQR) | 7.7% | 14.3% |
| Standard Deviation (Sample) | 7.1% | 10.2% |
| Standard Deviation (Population) | 6.9% | 10.1% |
Similar Demographics by 3 or more Vehicles in Household
Demographics Similar to Immigrants from Saudi Arabia by 3 or more Vehicles in Household
In terms of 3 or more vehicles in household, the demographic groups most similar to Immigrants from Saudi Arabia are Venezuelan (18.0%, a difference of 0.020%), Immigrants from Eastern Africa (18.0%, a difference of 0.060%), Carpatho Rusyn (18.0%, a difference of 0.19%), Alsatian (18.0%, a difference of 0.22%), and Immigrants from Australia (18.1%, a difference of 0.35%).
| Demographics | Rating | Rank | 3 or more Vehicles in Household |
| Hopi | 2.5 /100 | #242 | Tragic 18.2% |
| Immigrants | Europe | 2.4 /100 | #243 | Tragic 18.1% |
| Mongolians | 2.3 /100 | #244 | Tragic 18.1% |
| Immigrants | Belize | 2.1 /100 | #245 | Tragic 18.1% |
| Immigrants | Australia | 2.0 /100 | #246 | Tragic 18.1% |
| Carpatho Rusyns | 1.9 /100 | #247 | Tragic 18.0% |
| Immigrants | Eastern Africa | 1.8 /100 | #248 | Tragic 18.0% |
| Immigrants | Saudi Arabia | 1.7 /100 | #249 | Tragic 18.0% |
| Venezuelans | 1.7 /100 | #250 | Tragic 18.0% |
| Alsatians | 1.5 /100 | #251 | Tragic 18.0% |
| Immigrants | Southern Europe | 1.4 /100 | #252 | Tragic 17.9% |
| Immigrants | Ethiopia | 1.3 /100 | #253 | Tragic 17.9% |
| Ethiopians | 1.2 /100 | #254 | Tragic 17.9% |
| Immigrants | Turkey | 1.2 /100 | #255 | Tragic 17.9% |
| Sub-Saharan Africans | 1.1 /100 | #256 | Tragic 17.9% |
Demographics Similar to Immigrants from Zimbabwe by 3 or more Vehicles in Household
In terms of 3 or more vehicles in household, the demographic groups most similar to Immigrants from Zimbabwe are South American Indian (19.1%, a difference of 0.010%), Indian (Asian) (19.1%, a difference of 0.050%), Immigrants from Kuwait (19.1%, a difference of 0.060%), Kenyan (19.1%, a difference of 0.080%), and Tsimshian (19.1%, a difference of 0.11%).
| Demographics | Rating | Rank | 3 or more Vehicles in Household |
| Cajuns | 36.0 /100 | #183 | Fair 19.3% |
| Latvians | 35.7 /100 | #184 | Fair 19.3% |
| Immigrants | Sri Lanka | 30.7 /100 | #185 | Fair 19.2% |
| Immigrants | Sweden | 29.0 /100 | #186 | Fair 19.2% |
| Immigrants | Hong Kong | 28.3 /100 | #187 | Fair 19.2% |
| Immigrants | Kuwait | 26.1 /100 | #188 | Fair 19.1% |
| Indians (Asian) | 26.0 /100 | #189 | Fair 19.1% |
| Immigrants | Zimbabwe | 25.5 /100 | #190 | Fair 19.1% |
| South American Indians | 25.4 /100 | #191 | Fair 19.1% |
| Kenyans | 24.7 /100 | #192 | Fair 19.1% |
| Tsimshian | 24.4 /100 | #193 | Fair 19.1% |
| Serbians | 24.0 /100 | #194 | Fair 19.1% |
| Immigrants | Moldova | 23.6 /100 | #195 | Fair 19.1% |
| Central American Indians | 22.2 /100 | #196 | Fair 19.0% |
| Immigrants | Japan | 22.0 /100 | #197 | Fair 19.0% |