Immigrants from Peru vs Creek Bachelor's Degree
COMPARE
Immigrants from Peru
Creek
Bachelor's Degree
Bachelor's Degree Comparison
Immigrants from Peru
Creek
37.5%
BACHELOR'S DEGREE
41.3/ 100
METRIC RATING
185th/ 347
METRIC RANK
28.9%
BACHELOR'S DEGREE
0.0/ 100
METRIC RATING
319th/ 347
METRIC RANK
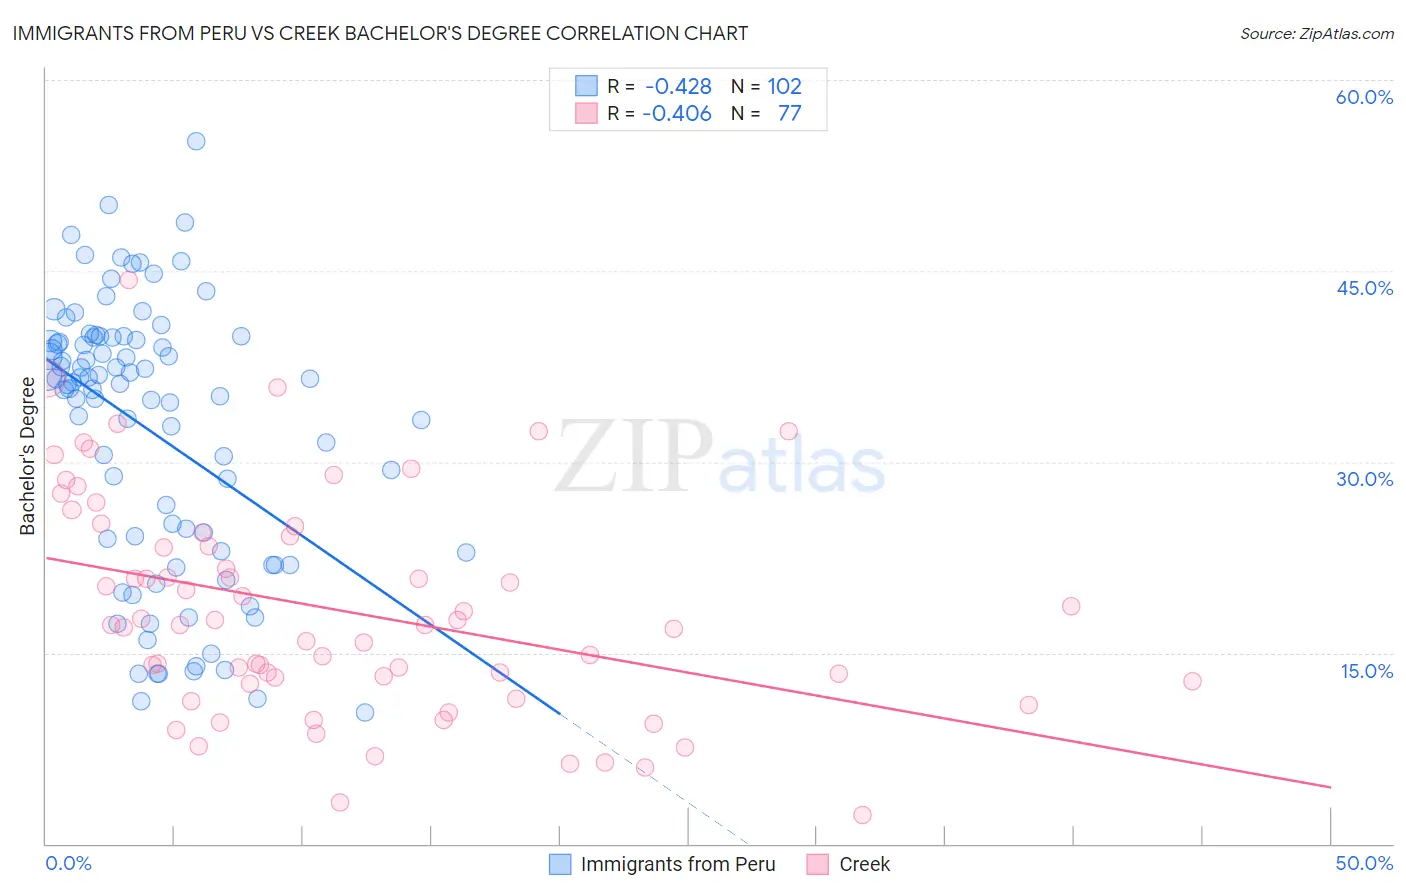
Immigrants from Peru vs Creek Bachelor's Degree Correlation Chart
The statistical analysis conducted on geographies consisting of 328,855,740 people shows a moderate negative correlation between the proportion of Immigrants from Peru and percentage of population with at least bachelor's degree education in the United States with a correlation coefficient (R) of -0.428 and weighted average of 37.5%. Similarly, the statistical analysis conducted on geographies consisting of 178,478,956 people shows a moderate negative correlation between the proportion of Creek and percentage of population with at least bachelor's degree education in the United States with a correlation coefficient (R) of -0.406 and weighted average of 28.9%, a difference of 30.0%.
Bachelor's Degree Correlation Summary
| Measurement | Immigrants from Peru | Creek |
| Minimum | 10.3% | 2.3% |
| Maximum | 55.2% | 44.3% |
| Range | 44.9% | 42.0% |
| Mean | 32.4% | 18.4% |
| Median | 36.1% | 17.1% |
| Interquartile 25% (IQ1) | 23.0% | 12.7% |
| Interquartile 75% (IQ3) | 39.5% | 24.3% |
| Interquartile Range (IQR) | 16.5% | 11.6% |
| Standard Deviation (Sample) | 10.6% | 8.6% |
| Standard Deviation (Population) | 10.5% | 8.6% |
Similar Demographics by Bachelor's Degree
Demographics Similar to Immigrants from Peru by Bachelor's Degree
In terms of bachelor's degree, the demographic groups most similar to Immigrants from Peru are Scandinavian (37.5%, a difference of 0.040%), Senegalese (37.5%, a difference of 0.080%), Norwegian (37.5%, a difference of 0.10%), English (37.4%, a difference of 0.17%), and Immigrants from Bosnia and Herzegovina (37.6%, a difference of 0.21%).
| Demographics | Rating | Rank | Bachelor's Degree |
| Immigrants | Cameroon | 46.8 /100 | #178 | Average 37.7% |
| Immigrants | Colombia | 45.4 /100 | #179 | Average 37.7% |
| Irish | 44.3 /100 | #180 | Average 37.6% |
| Immigrants | Senegal | 43.8 /100 | #181 | Average 37.6% |
| Immigrants | Bosnia and Herzegovina | 43.4 /100 | #182 | Average 37.6% |
| Senegalese | 42.2 /100 | #183 | Average 37.5% |
| Scandinavians | 41.7 /100 | #184 | Average 37.5% |
| Immigrants | Peru | 41.3 /100 | #185 | Average 37.5% |
| Norwegians | 40.4 /100 | #186 | Average 37.5% |
| English | 39.7 /100 | #187 | Fair 37.4% |
| Immigrants | Oceania | 37.3 /100 | #188 | Fair 37.3% |
| Slovaks | 36.9 /100 | #189 | Fair 37.3% |
| Swiss | 34.1 /100 | #190 | Fair 37.2% |
| Nigerians | 33.9 /100 | #191 | Fair 37.2% |
| Immigrants | Vietnam | 32.1 /100 | #192 | Fair 37.1% |
Demographics Similar to Creek by Bachelor's Degree
In terms of bachelor's degree, the demographic groups most similar to Creek are Kiowa (28.8%, a difference of 0.040%), Alaskan Athabascan (28.8%, a difference of 0.13%), Tsimshian (28.8%, a difference of 0.35%), Yaqui (29.0%, a difference of 0.45%), and Fijian (28.7%, a difference of 0.48%).
| Demographics | Rating | Rank | Bachelor's Degree |
| Seminole | 0.0 /100 | #312 | Tragic 29.4% |
| Alaska Natives | 0.0 /100 | #313 | Tragic 29.4% |
| Shoshone | 0.0 /100 | #314 | Tragic 29.3% |
| Immigrants | Cabo Verde | 0.0 /100 | #315 | Tragic 29.2% |
| Sioux | 0.0 /100 | #316 | Tragic 29.1% |
| Colville | 0.0 /100 | #317 | Tragic 29.0% |
| Yaqui | 0.0 /100 | #318 | Tragic 29.0% |
| Creek | 0.0 /100 | #319 | Tragic 28.9% |
| Kiowa | 0.0 /100 | #320 | Tragic 28.8% |
| Alaskan Athabascans | 0.0 /100 | #321 | Tragic 28.8% |
| Tsimshian | 0.0 /100 | #322 | Tragic 28.8% |
| Fijians | 0.0 /100 | #323 | Tragic 28.7% |
| Dutch West Indians | 0.0 /100 | #324 | Tragic 28.5% |
| Pennsylvania Germans | 0.0 /100 | #325 | Tragic 28.4% |
| Apache | 0.0 /100 | #326 | Tragic 28.3% |