Immigrants from Peru vs Creek In Labor Force | Age 30-34
COMPARE
Immigrants from Peru
Creek
In Labor Force | Age 30-34
In Labor Force | Age 30-34 Comparison
Immigrants from Peru
Creek
84.7%
IN LABOR FORCE | AGE 30-34
52.4/ 100
METRIC RATING
168th/ 347
METRIC RANK
80.4%
IN LABOR FORCE | AGE 30-34
0.0/ 100
METRIC RATING
329th/ 347
METRIC RANK
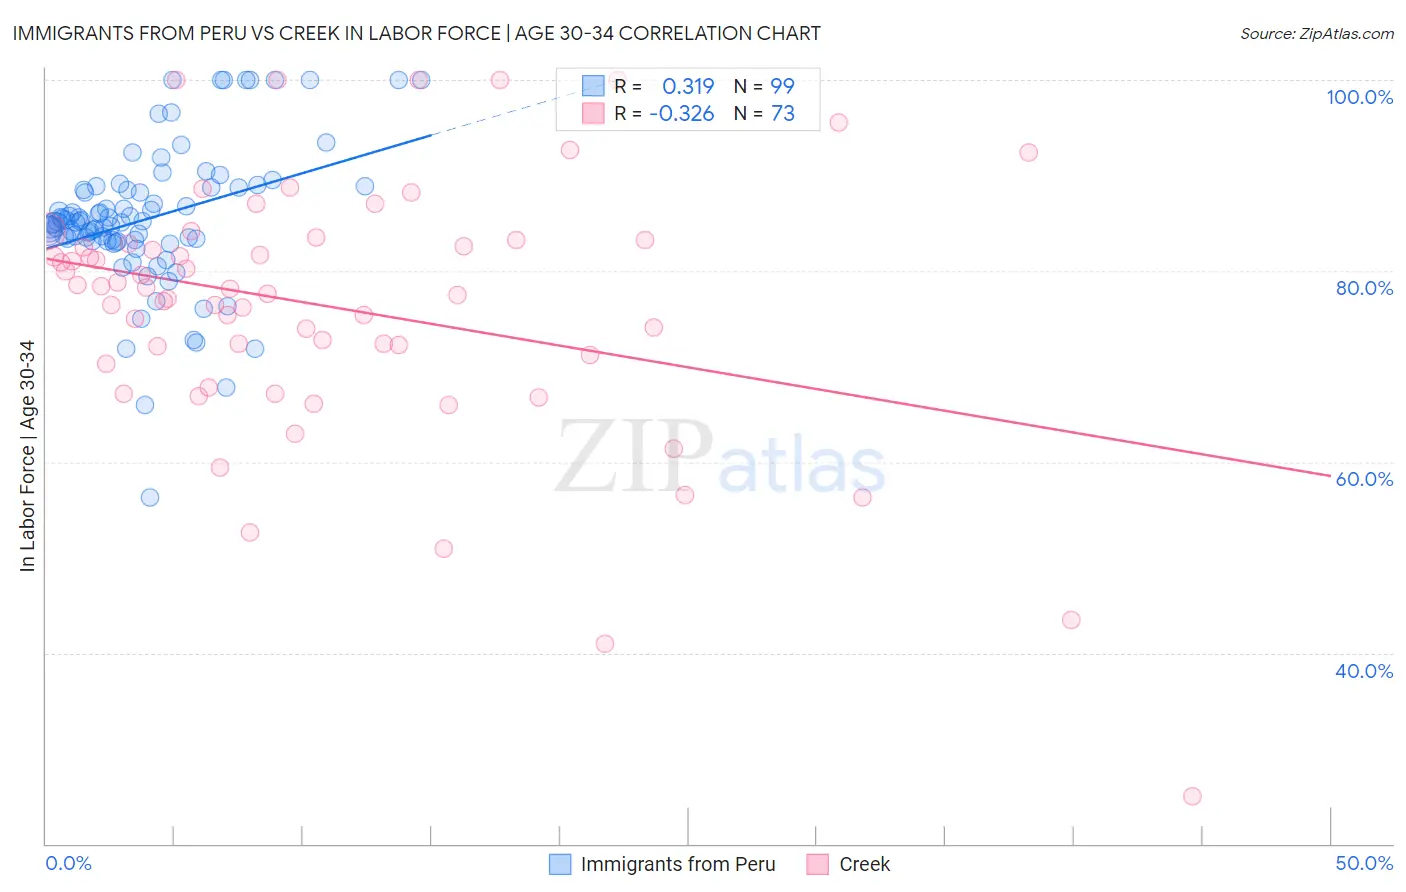
Immigrants from Peru vs Creek In Labor Force | Age 30-34 Correlation Chart
The statistical analysis conducted on geographies consisting of 328,740,513 people shows a mild positive correlation between the proportion of Immigrants from Peru and labor force participation rate among population between the ages 30 and 34 in the United States with a correlation coefficient (R) of 0.319 and weighted average of 84.7%. Similarly, the statistical analysis conducted on geographies consisting of 178,425,767 people shows a mild negative correlation between the proportion of Creek and labor force participation rate among population between the ages 30 and 34 in the United States with a correlation coefficient (R) of -0.326 and weighted average of 80.4%, a difference of 5.4%.
In Labor Force | Age 30-34 Correlation Summary
| Measurement | Immigrants from Peru | Creek |
| Minimum | 56.2% | 25.0% |
| Maximum | 100.0% | 100.0% |
| Range | 43.8% | 75.0% |
| Mean | 85.4% | 76.2% |
| Median | 85.1% | 78.2% |
| Interquartile 25% (IQ1) | 83.1% | 70.7% |
| Interquartile 75% (IQ3) | 88.7% | 83.1% |
| Interquartile Range (IQR) | 5.6% | 12.4% |
| Standard Deviation (Sample) | 7.5% | 13.7% |
| Standard Deviation (Population) | 7.4% | 13.6% |
Similar Demographics by In Labor Force | Age 30-34
Demographics Similar to Immigrants from Peru by In Labor Force | Age 30-34
In terms of in labor force | age 30-34, the demographic groups most similar to Immigrants from Peru are South American Indian (84.7%, a difference of 0.0%), Immigrants from Burma/Myanmar (84.7%, a difference of 0.0%), Irish (84.7%, a difference of 0.0%), Immigrants from England (84.7%, a difference of 0.0%), and Immigrants from South Eastern Asia (84.7%, a difference of 0.010%).
| Demographics | Rating | Rank | In Labor Force | Age 30-34 |
| Immigrants | Cambodia | 60.7 /100 | #161 | Good 84.7% |
| South Americans | 58.7 /100 | #162 | Average 84.7% |
| Immigrants | Uruguay | 57.4 /100 | #163 | Average 84.7% |
| Icelanders | 56.8 /100 | #164 | Average 84.7% |
| Immigrants | Western Europe | 56.7 /100 | #165 | Average 84.7% |
| Afghans | 55.2 /100 | #166 | Average 84.7% |
| Immigrants | South Eastern Asia | 54.2 /100 | #167 | Average 84.7% |
| Immigrants | Peru | 52.4 /100 | #168 | Average 84.7% |
| South American Indians | 52.1 /100 | #169 | Average 84.7% |
| Immigrants | Burma/Myanmar | 52.0 /100 | #170 | Average 84.7% |
| Irish | 52.0 /100 | #171 | Average 84.7% |
| Immigrants | England | 51.7 /100 | #172 | Average 84.7% |
| Israelis | 51.1 /100 | #173 | Average 84.7% |
| Finns | 50.0 /100 | #174 | Average 84.7% |
| Immigrants | South America | 50.0 /100 | #175 | Average 84.7% |
Demographics Similar to Creek by In Labor Force | Age 30-34
In terms of in labor force | age 30-34, the demographic groups most similar to Creek are Sioux (80.4%, a difference of 0.010%), Pueblo (80.0%, a difference of 0.40%), Colville (80.7%, a difference of 0.41%), Houma (79.9%, a difference of 0.58%), and Seminole (80.8%, a difference of 0.60%).
| Demographics | Rating | Rank | In Labor Force | Age 30-34 |
| Puerto Ricans | 0.0 /100 | #322 | Tragic 81.2% |
| Paiute | 0.0 /100 | #323 | Tragic 81.2% |
| Cheyenne | 0.0 /100 | #324 | Tragic 81.1% |
| Dutch West Indians | 0.0 /100 | #325 | Tragic 81.0% |
| Seminole | 0.0 /100 | #326 | Tragic 80.8% |
| Colville | 0.0 /100 | #327 | Tragic 80.7% |
| Sioux | 0.0 /100 | #328 | Tragic 80.4% |
| Creek | 0.0 /100 | #329 | Tragic 80.4% |
| Pueblo | 0.0 /100 | #330 | Tragic 80.0% |
| Houma | 0.0 /100 | #331 | Tragic 79.9% |
| Kiowa | 0.0 /100 | #332 | Tragic 79.8% |
| Inupiat | 0.0 /100 | #333 | Tragic 79.7% |
| Hopi | 0.0 /100 | #334 | Tragic 79.3% |
| Marshallese | 0.0 /100 | #335 | Tragic 79.2% |
| Natives/Alaskans | 0.0 /100 | #336 | Tragic 79.2% |