Immigrants from Oceania vs Tohono O'odham 2 or more Vehicles in Household
COMPARE
Immigrants from Oceania
Tohono O'odham
2 or more Vehicles in Household
2 or more Vehicles in Household Comparison
Immigrants from Oceania
Tohono O'odham
57.5%
2 OR MORE VEHICLES IN HOUSEHOLD
98.2/ 100
METRIC RATING
106th/ 347
METRIC RANK
50.0%
2 OR MORE VEHICLES IN HOUSEHOLD
0.0/ 100
METRIC RATING
303rd/ 347
METRIC RANK
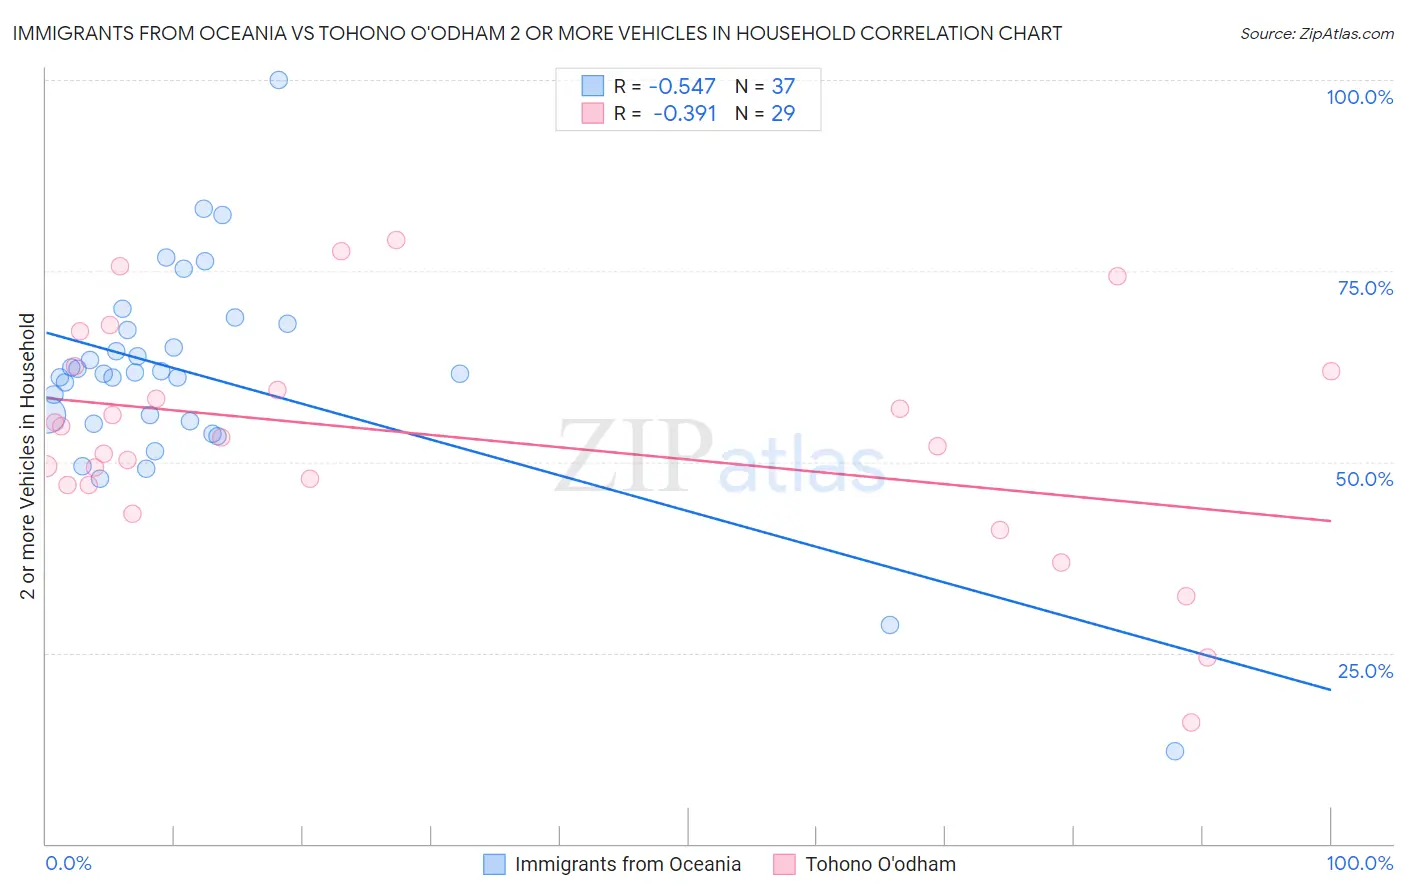
Immigrants from Oceania vs Tohono O'odham 2 or more Vehicles in Household Correlation Chart
The statistical analysis conducted on geographies consisting of 305,385,157 people shows a substantial negative correlation between the proportion of Immigrants from Oceania and percentage of households with 2 or more vehicles available in the United States with a correlation coefficient (R) of -0.547 and weighted average of 57.5%. Similarly, the statistical analysis conducted on geographies consisting of 58,718,439 people shows a mild negative correlation between the proportion of Tohono O'odham and percentage of households with 2 or more vehicles available in the United States with a correlation coefficient (R) of -0.391 and weighted average of 50.0%, a difference of 15.1%.
2 or more Vehicles in Household Correlation Summary
| Measurement | Immigrants from Oceania | Tohono O'odham |
| Minimum | 12.2% | 15.9% |
| Maximum | 100.0% | 79.0% |
| Range | 87.8% | 63.1% |
| Mean | 61.2% | 53.3% |
| Median | 61.5% | 53.2% |
| Interquartile 25% (IQ1) | 55.1% | 47.0% |
| Interquartile 75% (IQ3) | 67.7% | 62.2% |
| Interquartile Range (IQR) | 12.5% | 15.3% |
| Standard Deviation (Sample) | 14.6% | 14.9% |
| Standard Deviation (Population) | 14.4% | 14.6% |
Similar Demographics by 2 or more Vehicles in Household
Demographics Similar to Immigrants from Oceania by 2 or more Vehicles in Household
In terms of 2 or more vehicles in household, the demographic groups most similar to Immigrants from Oceania are Immigrants from Bolivia (57.6%, a difference of 0.020%), Jordanian (57.6%, a difference of 0.020%), Immigrants from Indonesia (57.6%, a difference of 0.020%), Immigrants from Korea (57.6%, a difference of 0.020%), and Immigrants from Netherlands (57.5%, a difference of 0.020%).
| Demographics | Rating | Rank | 2 or more Vehicles in Household |
| Cajuns | 98.5 /100 | #99 | Exceptional 57.7% |
| Fijians | 98.4 /100 | #100 | Exceptional 57.6% |
| Lebanese | 98.3 /100 | #101 | Exceptional 57.6% |
| Immigrants | Bolivia | 98.2 /100 | #102 | Exceptional 57.6% |
| Jordanians | 98.2 /100 | #103 | Exceptional 57.6% |
| Immigrants | Indonesia | 98.2 /100 | #104 | Exceptional 57.6% |
| Immigrants | Korea | 98.2 /100 | #105 | Exceptional 57.6% |
| Immigrants | Oceania | 98.2 /100 | #106 | Exceptional 57.5% |
| Immigrants | Netherlands | 98.2 /100 | #107 | Exceptional 57.5% |
| Immigrants | Canada | 98.1 /100 | #108 | Exceptional 57.5% |
| Immigrants | North America | 98.1 /100 | #109 | Exceptional 57.5% |
| Japanese | 98.0 /100 | #110 | Exceptional 57.5% |
| Greeks | 98.0 /100 | #111 | Exceptional 57.5% |
| Pueblo | 98.0 /100 | #112 | Exceptional 57.5% |
| Zimbabweans | 96.9 /100 | #113 | Exceptional 57.2% |
Demographics Similar to Tohono O'odham by 2 or more Vehicles in Household
In terms of 2 or more vehicles in household, the demographic groups most similar to Tohono O'odham are Immigrants from Belize (49.9%, a difference of 0.20%), Immigrants from South America (50.2%, a difference of 0.37%), Immigrants from Greece (50.2%, a difference of 0.43%), Immigrants from Russia (50.3%, a difference of 0.62%), and Immigrants from Morocco (50.3%, a difference of 0.65%).
| Demographics | Rating | Rank | 2 or more Vehicles in Household |
| Immigrants | Somalia | 0.0 /100 | #296 | Tragic 50.5% |
| Immigrants | Spain | 0.0 /100 | #297 | Tragic 50.4% |
| Paraguayans | 0.0 /100 | #298 | Tragic 50.3% |
| Immigrants | Morocco | 0.0 /100 | #299 | Tragic 50.3% |
| Immigrants | Russia | 0.0 /100 | #300 | Tragic 50.3% |
| Immigrants | Greece | 0.0 /100 | #301 | Tragic 50.2% |
| Immigrants | South America | 0.0 /100 | #302 | Tragic 50.2% |
| Tohono O'odham | 0.0 /100 | #303 | Tragic 50.0% |
| Immigrants | Belize | 0.0 /100 | #304 | Tragic 49.9% |
| Immigrants | Western Africa | 0.0 /100 | #305 | Tragic 49.4% |
| Immigrants | Israel | 0.0 /100 | #306 | Tragic 49.2% |
| Hopi | 0.0 /100 | #307 | Tragic 49.0% |
| Albanians | 0.0 /100 | #308 | Tragic 49.0% |
| Moroccans | 0.0 /100 | #309 | Tragic 48.8% |
| Ghanaians | 0.0 /100 | #310 | Tragic 48.0% |