Native Hawaiian vs Tohono O'odham 2 or more Vehicles in Household
COMPARE
Native Hawaiian
Tohono O'odham
2 or more Vehicles in Household
2 or more Vehicles in Household Comparison
Native Hawaiians
Tohono O'odham
61.4%
2 OR MORE VEHICLES IN HOUSEHOLD
100.0/ 100
METRIC RATING
16th/ 347
METRIC RANK
50.0%
2 OR MORE VEHICLES IN HOUSEHOLD
0.0/ 100
METRIC RATING
303rd/ 347
METRIC RANK
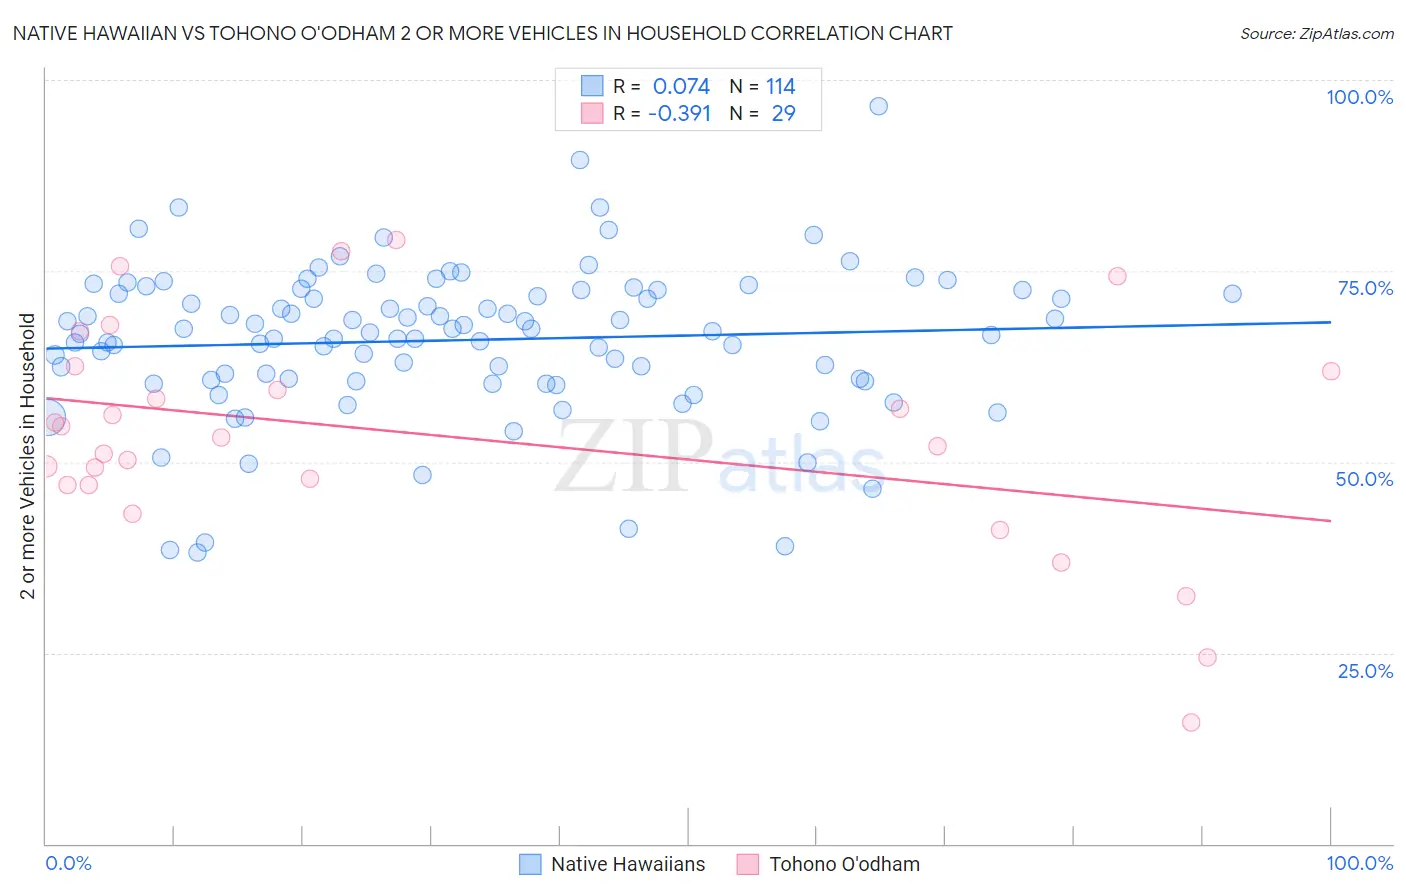
Native Hawaiian vs Tohono O'odham 2 or more Vehicles in Household Correlation Chart
The statistical analysis conducted on geographies consisting of 331,863,801 people shows a slight positive correlation between the proportion of Native Hawaiians and percentage of households with 2 or more vehicles available in the United States with a correlation coefficient (R) of 0.074 and weighted average of 61.4%. Similarly, the statistical analysis conducted on geographies consisting of 58,718,439 people shows a mild negative correlation between the proportion of Tohono O'odham and percentage of households with 2 or more vehicles available in the United States with a correlation coefficient (R) of -0.391 and weighted average of 50.0%, a difference of 22.8%.
2 or more Vehicles in Household Correlation Summary
| Measurement | Native Hawaiian | Tohono O'odham |
| Minimum | 38.2% | 15.9% |
| Maximum | 96.6% | 79.0% |
| Range | 58.3% | 63.1% |
| Mean | 65.9% | 53.3% |
| Median | 67.0% | 53.2% |
| Interquartile 25% (IQ1) | 60.8% | 47.0% |
| Interquartile 75% (IQ3) | 72.5% | 62.2% |
| Interquartile Range (IQR) | 11.7% | 15.3% |
| Standard Deviation (Sample) | 9.9% | 14.9% |
| Standard Deviation (Population) | 9.9% | 14.6% |
Similar Demographics by 2 or more Vehicles in Household
Demographics Similar to Native Hawaiians by 2 or more Vehicles in Household
In terms of 2 or more vehicles in household, the demographic groups most similar to Native Hawaiians are Nepalese (61.4%, a difference of 0.020%), Basque (61.4%, a difference of 0.070%), European (61.4%, a difference of 0.080%), Czech (61.5%, a difference of 0.11%), and Samoan (61.5%, a difference of 0.16%).
| Demographics | Rating | Rank | 2 or more Vehicles in Household |
| Swedes | 100.0 /100 | #9 | Exceptional 61.8% |
| Mexicans | 100.0 /100 | #10 | Exceptional 61.7% |
| Dutch | 100.0 /100 | #11 | Exceptional 61.6% |
| Germans | 100.0 /100 | #12 | Exceptional 61.6% |
| Samoans | 100.0 /100 | #13 | Exceptional 61.5% |
| Czechs | 100.0 /100 | #14 | Exceptional 61.5% |
| Nepalese | 100.0 /100 | #15 | Exceptional 61.4% |
| Native Hawaiians | 100.0 /100 | #16 | Exceptional 61.4% |
| Basques | 100.0 /100 | #17 | Exceptional 61.4% |
| Europeans | 100.0 /100 | #18 | Exceptional 61.4% |
| Scottish | 100.0 /100 | #19 | Exceptional 61.2% |
| Sri Lankans | 100.0 /100 | #20 | Exceptional 61.0% |
| Koreans | 100.0 /100 | #21 | Exceptional 61.0% |
| Swiss | 100.0 /100 | #22 | Exceptional 61.0% |
| Scotch-Irish | 100.0 /100 | #23 | Exceptional 60.9% |
Demographics Similar to Tohono O'odham by 2 or more Vehicles in Household
In terms of 2 or more vehicles in household, the demographic groups most similar to Tohono O'odham are Immigrants from Belize (49.9%, a difference of 0.20%), Immigrants from South America (50.2%, a difference of 0.37%), Immigrants from Greece (50.2%, a difference of 0.43%), Immigrants from Russia (50.3%, a difference of 0.62%), and Immigrants from Morocco (50.3%, a difference of 0.65%).
| Demographics | Rating | Rank | 2 or more Vehicles in Household |
| Immigrants | Somalia | 0.0 /100 | #296 | Tragic 50.5% |
| Immigrants | Spain | 0.0 /100 | #297 | Tragic 50.4% |
| Paraguayans | 0.0 /100 | #298 | Tragic 50.3% |
| Immigrants | Morocco | 0.0 /100 | #299 | Tragic 50.3% |
| Immigrants | Russia | 0.0 /100 | #300 | Tragic 50.3% |
| Immigrants | Greece | 0.0 /100 | #301 | Tragic 50.2% |
| Immigrants | South America | 0.0 /100 | #302 | Tragic 50.2% |
| Tohono O'odham | 0.0 /100 | #303 | Tragic 50.0% |
| Immigrants | Belize | 0.0 /100 | #304 | Tragic 49.9% |
| Immigrants | Western Africa | 0.0 /100 | #305 | Tragic 49.4% |
| Immigrants | Israel | 0.0 /100 | #306 | Tragic 49.2% |
| Hopi | 0.0 /100 | #307 | Tragic 49.0% |
| Albanians | 0.0 /100 | #308 | Tragic 49.0% |
| Moroccans | 0.0 /100 | #309 | Tragic 48.8% |
| Ghanaians | 0.0 /100 | #310 | Tragic 48.0% |