Immigrants from Oceania vs Tohono O'odham College, 1 year or more
COMPARE
Immigrants from Oceania
Tohono O'odham
College, 1 year or more
College, 1 year or more Comparison
Immigrants from Oceania
Tohono O'odham
59.4%
COLLEGE, 1 YEAR OR MORE
51.2/ 100
METRIC RATING
173rd/ 347
METRIC RANK
47.1%
COLLEGE, 1 YEAR OR MORE
0.0/ 100
METRIC RATING
343rd/ 347
METRIC RANK
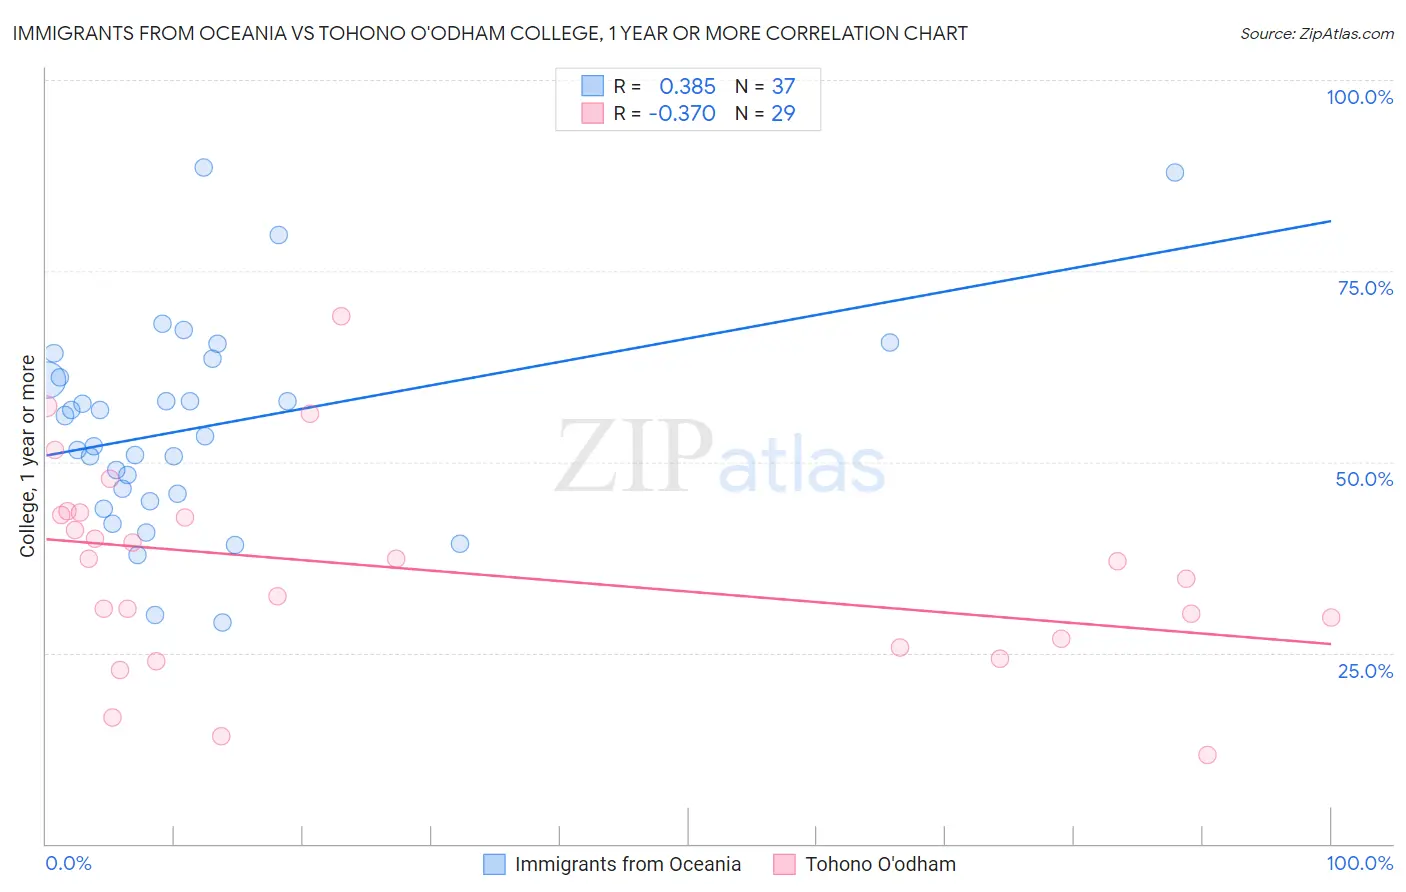
Immigrants from Oceania vs Tohono O'odham College, 1 year or more Correlation Chart
The statistical analysis conducted on geographies consisting of 305,519,500 people shows a mild positive correlation between the proportion of Immigrants from Oceania and percentage of population with at least college, 1 year or more education in the United States with a correlation coefficient (R) of 0.385 and weighted average of 59.4%. Similarly, the statistical analysis conducted on geographies consisting of 58,729,835 people shows a mild negative correlation between the proportion of Tohono O'odham and percentage of population with at least college, 1 year or more education in the United States with a correlation coefficient (R) of -0.370 and weighted average of 47.1%, a difference of 26.1%.
College, 1 year or more Correlation Summary
| Measurement | Immigrants from Oceania | Tohono O'odham |
| Minimum | 28.9% | 11.6% |
| Maximum | 88.6% | 69.1% |
| Range | 59.6% | 57.5% |
| Mean | 54.6% | 35.9% |
| Median | 53.4% | 36.9% |
| Interquartile 25% (IQ1) | 45.3% | 26.3% |
| Interquartile 75% (IQ3) | 62.3% | 43.2% |
| Interquartile Range (IQR) | 16.9% | 16.9% |
| Standard Deviation (Sample) | 13.6% | 13.2% |
| Standard Deviation (Population) | 13.4% | 12.9% |
Similar Demographics by College, 1 year or more
Demographics Similar to Immigrants from Oceania by College, 1 year or more
In terms of college, 1 year or more, the demographic groups most similar to Immigrants from Oceania are Immigrants from Sierra Leone (59.5%, a difference of 0.050%), Welsh (59.5%, a difference of 0.060%), Immigrants from Albania (59.5%, a difference of 0.060%), Celtic (59.4%, a difference of 0.060%), and Immigrants from Southern Europe (59.5%, a difference of 0.080%).
| Demographics | Rating | Rank | College, 1 year or more |
| Immigrants | Africa | 56.1 /100 | #166 | Average 59.6% |
| Immigrants | North Macedonia | 53.1 /100 | #167 | Average 59.5% |
| Hungarians | 52.9 /100 | #168 | Average 59.5% |
| Immigrants | Southern Europe | 52.7 /100 | #169 | Average 59.5% |
| Welsh | 52.4 /100 | #170 | Average 59.5% |
| Immigrants | Albania | 52.3 /100 | #171 | Average 59.5% |
| Immigrants | Sierra Leone | 52.2 /100 | #172 | Average 59.5% |
| Immigrants | Oceania | 51.2 /100 | #173 | Average 59.4% |
| Celtics | 50.0 /100 | #174 | Average 59.4% |
| Sri Lankans | 49.0 /100 | #175 | Average 59.4% |
| Immigrants | Poland | 48.9 /100 | #176 | Average 59.4% |
| Tlingit-Haida | 48.4 /100 | #177 | Average 59.4% |
| Czechoslovakians | 48.3 /100 | #178 | Average 59.4% |
| Bermudans | 46.6 /100 | #179 | Average 59.3% |
| Yugoslavians | 44.1 /100 | #180 | Average 59.2% |
Demographics Similar to Tohono O'odham by College, 1 year or more
In terms of college, 1 year or more, the demographic groups most similar to Tohono O'odham are Inupiat (47.2%, a difference of 0.22%), Immigrants from Mexico (47.5%, a difference of 0.79%), Yakama (46.2%, a difference of 2.0%), Immigrants from Cabo Verde (48.1%, a difference of 2.0%), and Immigrants from the Azores (48.4%, a difference of 2.6%).
| Demographics | Rating | Rank | College, 1 year or more |
| Immigrants | Dominican Republic | 0.0 /100 | #333 | Tragic 49.1% |
| Lumbee | 0.0 /100 | #334 | Tragic 48.9% |
| Yuman | 0.0 /100 | #335 | Tragic 48.7% |
| Spanish American Indians | 0.0 /100 | #336 | Tragic 48.5% |
| Pennsylvania Germans | 0.0 /100 | #337 | Tragic 48.5% |
| Immigrants | Central America | 0.0 /100 | #338 | Tragic 48.5% |
| Immigrants | Azores | 0.0 /100 | #339 | Tragic 48.4% |
| Immigrants | Cabo Verde | 0.0 /100 | #340 | Tragic 48.1% |
| Immigrants | Mexico | 0.0 /100 | #341 | Tragic 47.5% |
| Inupiat | 0.0 /100 | #342 | Tragic 47.2% |
| Tohono O'odham | 0.0 /100 | #343 | Tragic 47.1% |
| Yakama | 0.0 /100 | #344 | Tragic 46.2% |
| Pima | 0.0 /100 | #345 | Tragic 45.6% |
| Houma | 0.0 /100 | #346 | Tragic 41.2% |
| Yup'ik | 0.0 /100 | #347 | Tragic 39.4% |