Immigrants from Oceania vs Tohono O'odham Median Female Earnings
COMPARE
Immigrants from Oceania
Tohono O'odham
Median Female Earnings
Median Female Earnings Comparison
Immigrants from Oceania
Tohono O'odham
$40,297
MEDIAN FEMALE EARNINGS
77.6/ 100
METRIC RATING
154th/ 347
METRIC RANK
$33,205
MEDIAN FEMALE EARNINGS
0.0/ 100
METRIC RATING
340th/ 347
METRIC RANK
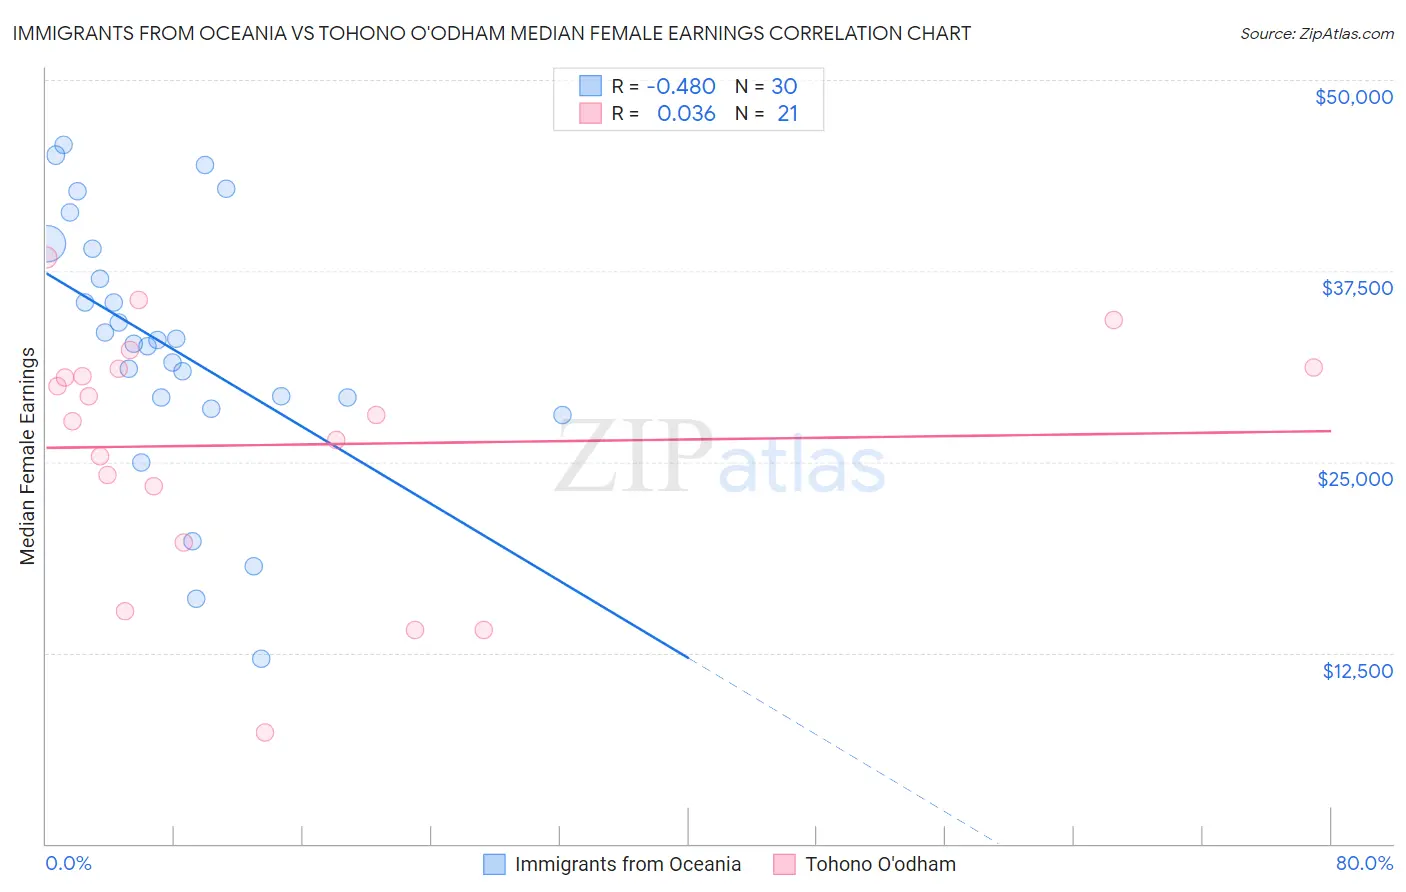
Immigrants from Oceania vs Tohono O'odham Median Female Earnings Correlation Chart
The statistical analysis conducted on geographies consisting of 305,406,455 people shows a moderate negative correlation between the proportion of Immigrants from Oceania and median female earnings in the United States with a correlation coefficient (R) of -0.480 and weighted average of $40,297. Similarly, the statistical analysis conducted on geographies consisting of 58,716,616 people shows no correlation between the proportion of Tohono O'odham and median female earnings in the United States with a correlation coefficient (R) of 0.036 and weighted average of $33,205, a difference of 21.4%.
Median Female Earnings Correlation Summary
| Measurement | Immigrants from Oceania | Tohono O'odham |
| Minimum | $12,128 | $7,287 |
| Maximum | $45,730 | $38,345 |
| Range | $33,602 | $31,058 |
| Mean | $32,539 | $26,118 |
| Median | $32,878 | $28,033 |
| Interquartile 25% (IQ1) | $29,179 | $21,596 |
| Interquartile 75% (IQ3) | $38,985 | $31,136 |
| Interquartile Range (IQR) | $9,806 | $9,540 |
| Standard Deviation (Sample) | $8,467 | $8,020 |
| Standard Deviation (Population) | $8,325 | $7,826 |
Similar Demographics by Median Female Earnings
Demographics Similar to Immigrants from Oceania by Median Female Earnings
In terms of median female earnings, the demographic groups most similar to Immigrants from Oceania are British West Indian ($40,299, a difference of 0.010%), West Indian ($40,317, a difference of 0.050%), Immigrants from Africa ($40,257, a difference of 0.10%), Immigrants from Armenia ($40,340, a difference of 0.11%), and Immigrants from Cameroon ($40,354, a difference of 0.14%).
| Demographics | Rating | Rank | Median Female Earnings |
| Vietnamese | 80.4 /100 | #147 | Excellent $40,377 |
| Poles | 80.2 /100 | #148 | Excellent $40,371 |
| Immigrants | Cameroon | 79.7 /100 | #149 | Good $40,354 |
| Immigrants | Chile | 79.6 /100 | #150 | Good $40,353 |
| Immigrants | Armenia | 79.2 /100 | #151 | Good $40,340 |
| West Indians | 78.4 /100 | #152 | Good $40,317 |
| British West Indians | 77.7 /100 | #153 | Good $40,299 |
| Immigrants | Oceania | 77.6 /100 | #154 | Good $40,297 |
| Immigrants | Africa | 76.2 /100 | #155 | Good $40,257 |
| Peruvians | 75.3 /100 | #156 | Good $40,234 |
| Portuguese | 73.0 /100 | #157 | Good $40,177 |
| Immigrants | Senegal | 72.2 /100 | #158 | Good $40,157 |
| Immigrants | Vietnam | 72.0 /100 | #159 | Good $40,153 |
| Inupiat | 68.9 /100 | #160 | Good $40,080 |
| Alsatians | 68.0 /100 | #161 | Good $40,060 |
Demographics Similar to Tohono O'odham by Median Female Earnings
In terms of median female earnings, the demographic groups most similar to Tohono O'odham are Immigrants from Mexico ($33,236, a difference of 0.090%), Immigrants from Cuba ($33,291, a difference of 0.26%), Yakama ($33,354, a difference of 0.45%), Navajo ($33,046, a difference of 0.48%), and Ottawa ($33,378, a difference of 0.52%).
| Demographics | Rating | Rank | Median Female Earnings |
| Mexicans | 0.0 /100 | #333 | Tragic $33,664 |
| Spanish American Indians | 0.0 /100 | #334 | Tragic $33,625 |
| Creek | 0.0 /100 | #335 | Tragic $33,437 |
| Ottawa | 0.0 /100 | #336 | Tragic $33,378 |
| Yakama | 0.0 /100 | #337 | Tragic $33,354 |
| Immigrants | Cuba | 0.0 /100 | #338 | Tragic $33,291 |
| Immigrants | Mexico | 0.0 /100 | #339 | Tragic $33,236 |
| Tohono O'odham | 0.0 /100 | #340 | Tragic $33,205 |
| Navajo | 0.0 /100 | #341 | Tragic $33,046 |
| Yup'ik | 0.0 /100 | #342 | Tragic $32,730 |
| Pueblo | 0.0 /100 | #343 | Tragic $32,564 |
| Lumbee | 0.0 /100 | #344 | Tragic $32,500 |
| Puerto Ricans | 0.0 /100 | #345 | Tragic $31,560 |
| Arapaho | 0.0 /100 | #346 | Tragic $31,489 |
| Houma | 0.0 /100 | #347 | Tragic $30,343 |