Immigrants from Bahamas vs Tohono O'odham 2 or more Vehicles in Household
COMPARE
Immigrants from Bahamas
Tohono O'odham
2 or more Vehicles in Household
2 or more Vehicles in Household Comparison
Immigrants from Bahamas
Tohono O'odham
52.5%
2 OR MORE VEHICLES IN HOUSEHOLD
0.5/ 100
METRIC RATING
260th/ 347
METRIC RANK
50.0%
2 OR MORE VEHICLES IN HOUSEHOLD
0.0/ 100
METRIC RATING
303rd/ 347
METRIC RANK
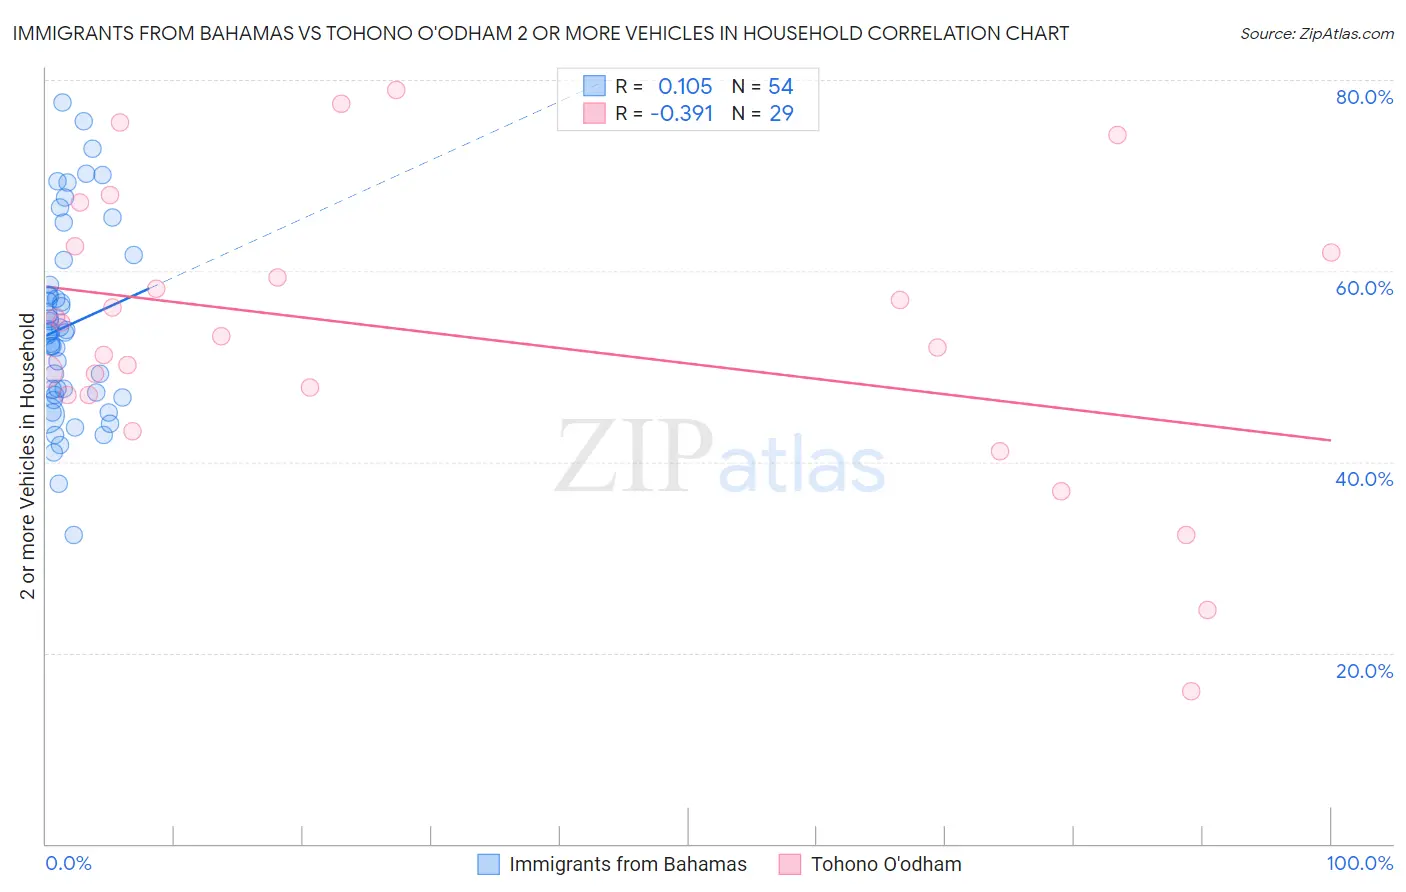
Immigrants from Bahamas vs Tohono O'odham 2 or more Vehicles in Household Correlation Chart
The statistical analysis conducted on geographies consisting of 104,618,237 people shows a poor positive correlation between the proportion of Immigrants from Bahamas and percentage of households with 2 or more vehicles available in the United States with a correlation coefficient (R) of 0.105 and weighted average of 52.5%. Similarly, the statistical analysis conducted on geographies consisting of 58,718,439 people shows a mild negative correlation between the proportion of Tohono O'odham and percentage of households with 2 or more vehicles available in the United States with a correlation coefficient (R) of -0.391 and weighted average of 50.0%, a difference of 4.9%.
2 or more Vehicles in Household Correlation Summary
| Measurement | Immigrants from Bahamas | Tohono O'odham |
| Minimum | 32.3% | 15.9% |
| Maximum | 77.7% | 79.0% |
| Range | 45.4% | 63.1% |
| Mean | 54.3% | 53.3% |
| Median | 53.6% | 53.2% |
| Interquartile 25% (IQ1) | 46.9% | 47.0% |
| Interquartile 75% (IQ3) | 58.5% | 62.2% |
| Interquartile Range (IQR) | 11.6% | 15.3% |
| Standard Deviation (Sample) | 10.0% | 14.9% |
| Standard Deviation (Population) | 9.9% | 14.6% |
Similar Demographics by 2 or more Vehicles in Household
Demographics Similar to Immigrants from Bahamas by 2 or more Vehicles in Household
In terms of 2 or more vehicles in household, the demographic groups most similar to Immigrants from Bahamas are Immigrants from Australia (52.4%, a difference of 0.030%), Alsatian (52.5%, a difference of 0.070%), Central American Indian (52.5%, a difference of 0.10%), Immigrants from Hong Kong (52.6%, a difference of 0.20%), and Immigrants from Northern Africa (52.3%, a difference of 0.23%).
| Demographics | Rating | Rank | 2 or more Vehicles in Household |
| Nigerians | 0.9 /100 | #253 | Tragic 52.8% |
| Immigrants | Malaysia | 0.8 /100 | #254 | Tragic 52.7% |
| Uruguayans | 0.7 /100 | #255 | Tragic 52.7% |
| Immigrants | Eritrea | 0.7 /100 | #256 | Tragic 52.6% |
| Immigrants | Hong Kong | 0.6 /100 | #257 | Tragic 52.6% |
| Central American Indians | 0.6 /100 | #258 | Tragic 52.5% |
| Alsatians | 0.6 /100 | #259 | Tragic 52.5% |
| Immigrants | Bahamas | 0.5 /100 | #260 | Tragic 52.5% |
| Immigrants | Australia | 0.5 /100 | #261 | Tragic 52.4% |
| Immigrants | Northern Africa | 0.4 /100 | #262 | Tragic 52.3% |
| Immigrants | Southern Europe | 0.4 /100 | #263 | Tragic 52.3% |
| Immigrants | Latvia | 0.4 /100 | #264 | Tragic 52.2% |
| Immigrants | Congo | 0.3 /100 | #265 | Tragic 52.1% |
| Immigrants | France | 0.2 /100 | #266 | Tragic 52.0% |
| Immigrants | Colombia | 0.2 /100 | #267 | Tragic 52.0% |
Demographics Similar to Tohono O'odham by 2 or more Vehicles in Household
In terms of 2 or more vehicles in household, the demographic groups most similar to Tohono O'odham are Immigrants from Belize (49.9%, a difference of 0.20%), Immigrants from South America (50.2%, a difference of 0.37%), Immigrants from Greece (50.2%, a difference of 0.43%), Immigrants from Russia (50.3%, a difference of 0.62%), and Immigrants from Morocco (50.3%, a difference of 0.65%).
| Demographics | Rating | Rank | 2 or more Vehicles in Household |
| Immigrants | Somalia | 0.0 /100 | #296 | Tragic 50.5% |
| Immigrants | Spain | 0.0 /100 | #297 | Tragic 50.4% |
| Paraguayans | 0.0 /100 | #298 | Tragic 50.3% |
| Immigrants | Morocco | 0.0 /100 | #299 | Tragic 50.3% |
| Immigrants | Russia | 0.0 /100 | #300 | Tragic 50.3% |
| Immigrants | Greece | 0.0 /100 | #301 | Tragic 50.2% |
| Immigrants | South America | 0.0 /100 | #302 | Tragic 50.2% |
| Tohono O'odham | 0.0 /100 | #303 | Tragic 50.0% |
| Immigrants | Belize | 0.0 /100 | #304 | Tragic 49.9% |
| Immigrants | Western Africa | 0.0 /100 | #305 | Tragic 49.4% |
| Immigrants | Israel | 0.0 /100 | #306 | Tragic 49.2% |
| Hopi | 0.0 /100 | #307 | Tragic 49.0% |
| Albanians | 0.0 /100 | #308 | Tragic 49.0% |
| Moroccans | 0.0 /100 | #309 | Tragic 48.8% |
| Ghanaians | 0.0 /100 | #310 | Tragic 48.0% |