Immigrants from Portugal vs Tohono O'odham 2 or more Vehicles in Household
COMPARE
Immigrants from Portugal
Tohono O'odham
2 or more Vehicles in Household
2 or more Vehicles in Household Comparison
Immigrants from Portugal
Tohono O'odham
52.8%
2 OR MORE VEHICLES IN HOUSEHOLD
1.0/ 100
METRIC RATING
252nd/ 347
METRIC RANK
50.0%
2 OR MORE VEHICLES IN HOUSEHOLD
0.0/ 100
METRIC RATING
303rd/ 347
METRIC RANK
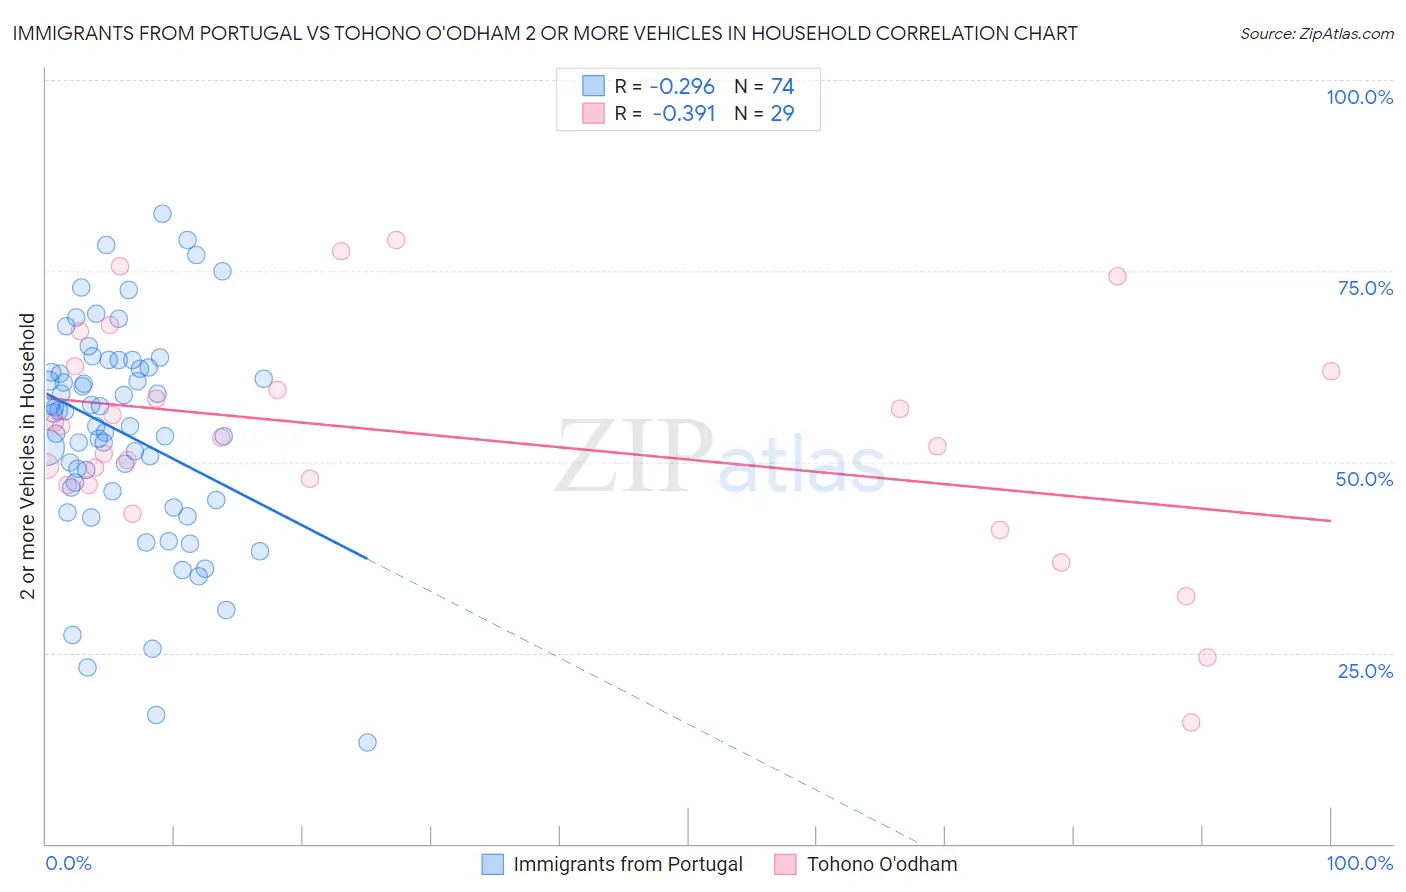
Immigrants from Portugal vs Tohono O'odham 2 or more Vehicles in Household Correlation Chart
The statistical analysis conducted on geographies consisting of 174,767,026 people shows a weak negative correlation between the proportion of Immigrants from Portugal and percentage of households with 2 or more vehicles available in the United States with a correlation coefficient (R) of -0.296 and weighted average of 52.8%. Similarly, the statistical analysis conducted on geographies consisting of 58,718,439 people shows a mild negative correlation between the proportion of Tohono O'odham and percentage of households with 2 or more vehicles available in the United States with a correlation coefficient (R) of -0.391 and weighted average of 50.0%, a difference of 5.6%.
2 or more Vehicles in Household Correlation Summary
| Measurement | Immigrants from Portugal | Tohono O'odham |
| Minimum | 13.2% | 15.9% |
| Maximum | 82.5% | 79.0% |
| Range | 69.3% | 63.1% |
| Mean | 53.7% | 53.3% |
| Median | 55.5% | 53.2% |
| Interquartile 25% (IQ1) | 46.2% | 47.0% |
| Interquartile 75% (IQ3) | 62.2% | 62.2% |
| Interquartile Range (IQR) | 16.0% | 15.3% |
| Standard Deviation (Sample) | 14.1% | 14.9% |
| Standard Deviation (Population) | 14.0% | 14.6% |
Similar Demographics by 2 or more Vehicles in Household
Demographics Similar to Immigrants from Portugal by 2 or more Vehicles in Household
In terms of 2 or more vehicles in household, the demographic groups most similar to Immigrants from Portugal are Immigrants from Sudan (52.8%, a difference of 0.010%), Immigrants from Brazil (52.8%, a difference of 0.050%), Mongolian (52.8%, a difference of 0.050%), Nigerian (52.8%, a difference of 0.050%), and Colombian (52.9%, a difference of 0.10%).
| Demographics | Rating | Rank | 2 or more Vehicles in Household |
| Immigrants | Ethiopia | 1.5 /100 | #245 | Tragic 53.0% |
| Immigrants | Nigeria | 1.2 /100 | #246 | Tragic 52.9% |
| Sierra Leoneans | 1.2 /100 | #247 | Tragic 52.9% |
| Colombians | 1.1 /100 | #248 | Tragic 52.9% |
| Immigrants | Brazil | 1.0 /100 | #249 | Tragic 52.8% |
| Mongolians | 1.0 /100 | #250 | Tragic 52.8% |
| Immigrants | Sudan | 1.0 /100 | #251 | Tragic 52.8% |
| Immigrants | Portugal | 1.0 /100 | #252 | Tragic 52.8% |
| Nigerians | 0.9 /100 | #253 | Tragic 52.8% |
| Immigrants | Malaysia | 0.8 /100 | #254 | Tragic 52.7% |
| Uruguayans | 0.7 /100 | #255 | Tragic 52.7% |
| Immigrants | Eritrea | 0.7 /100 | #256 | Tragic 52.6% |
| Immigrants | Hong Kong | 0.6 /100 | #257 | Tragic 52.6% |
| Central American Indians | 0.6 /100 | #258 | Tragic 52.5% |
| Alsatians | 0.6 /100 | #259 | Tragic 52.5% |
Demographics Similar to Tohono O'odham by 2 or more Vehicles in Household
In terms of 2 or more vehicles in household, the demographic groups most similar to Tohono O'odham are Immigrants from Belize (49.9%, a difference of 0.20%), Immigrants from South America (50.2%, a difference of 0.37%), Immigrants from Greece (50.2%, a difference of 0.43%), Immigrants from Russia (50.3%, a difference of 0.62%), and Immigrants from Morocco (50.3%, a difference of 0.65%).
| Demographics | Rating | Rank | 2 or more Vehicles in Household |
| Immigrants | Somalia | 0.0 /100 | #296 | Tragic 50.5% |
| Immigrants | Spain | 0.0 /100 | #297 | Tragic 50.4% |
| Paraguayans | 0.0 /100 | #298 | Tragic 50.3% |
| Immigrants | Morocco | 0.0 /100 | #299 | Tragic 50.3% |
| Immigrants | Russia | 0.0 /100 | #300 | Tragic 50.3% |
| Immigrants | Greece | 0.0 /100 | #301 | Tragic 50.2% |
| Immigrants | South America | 0.0 /100 | #302 | Tragic 50.2% |
| Tohono O'odham | 0.0 /100 | #303 | Tragic 50.0% |
| Immigrants | Belize | 0.0 /100 | #304 | Tragic 49.9% |
| Immigrants | Western Africa | 0.0 /100 | #305 | Tragic 49.4% |
| Immigrants | Israel | 0.0 /100 | #306 | Tragic 49.2% |
| Hopi | 0.0 /100 | #307 | Tragic 49.0% |
| Albanians | 0.0 /100 | #308 | Tragic 49.0% |
| Moroccans | 0.0 /100 | #309 | Tragic 48.8% |
| Ghanaians | 0.0 /100 | #310 | Tragic 48.0% |