Immigrants from Oceania vs Immigrants from South Eastern Asia 2 or more Vehicles in Household
COMPARE
Immigrants from Oceania
Immigrants from South Eastern Asia
2 or more Vehicles in Household
2 or more Vehicles in Household Comparison
Immigrants from Oceania
Immigrants from South Eastern Asia
57.5%
2 OR MORE VEHICLES IN HOUSEHOLD
98.2/ 100
METRIC RATING
106th/ 347
METRIC RANK
59.6%
2 OR MORE VEHICLES IN HOUSEHOLD
100.0/ 100
METRIC RATING
46th/ 347
METRIC RANK
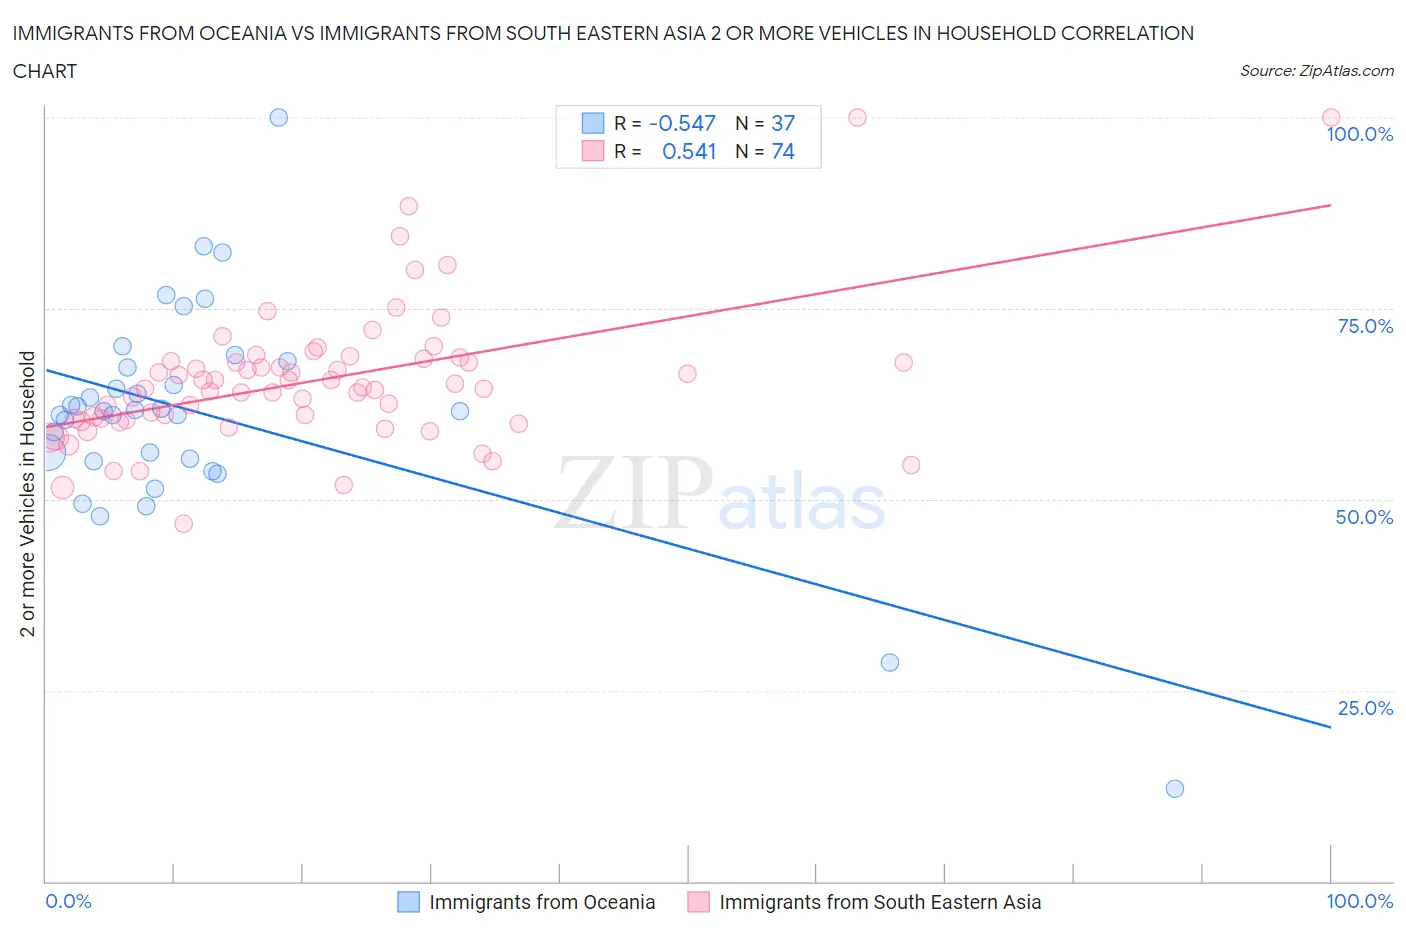
Immigrants from Oceania vs Immigrants from South Eastern Asia 2 or more Vehicles in Household Correlation Chart
The statistical analysis conducted on geographies consisting of 305,385,157 people shows a substantial negative correlation between the proportion of Immigrants from Oceania and percentage of households with 2 or more vehicles available in the United States with a correlation coefficient (R) of -0.547 and weighted average of 57.5%. Similarly, the statistical analysis conducted on geographies consisting of 512,289,317 people shows a substantial positive correlation between the proportion of Immigrants from South Eastern Asia and percentage of households with 2 or more vehicles available in the United States with a correlation coefficient (R) of 0.541 and weighted average of 59.6%, a difference of 3.6%.
2 or more Vehicles in Household Correlation Summary
| Measurement | Immigrants from Oceania | Immigrants from South Eastern Asia |
| Minimum | 12.2% | 46.9% |
| Maximum | 100.0% | 100.0% |
| Range | 87.8% | 53.1% |
| Mean | 61.2% | 65.6% |
| Median | 61.5% | 64.5% |
| Interquartile 25% (IQ1) | 55.1% | 60.4% |
| Interquartile 75% (IQ3) | 67.7% | 68.0% |
| Interquartile Range (IQR) | 12.5% | 7.6% |
| Standard Deviation (Sample) | 14.6% | 9.2% |
| Standard Deviation (Population) | 14.4% | 9.1% |
Similar Demographics by 2 or more Vehicles in Household
Demographics Similar to Immigrants from Oceania by 2 or more Vehicles in Household
In terms of 2 or more vehicles in household, the demographic groups most similar to Immigrants from Oceania are Immigrants from Bolivia (57.6%, a difference of 0.020%), Jordanian (57.6%, a difference of 0.020%), Immigrants from Indonesia (57.6%, a difference of 0.020%), Immigrants from Korea (57.6%, a difference of 0.020%), and Immigrants from Netherlands (57.5%, a difference of 0.020%).
| Demographics | Rating | Rank | 2 or more Vehicles in Household |
| Cajuns | 98.5 /100 | #99 | Exceptional 57.7% |
| Fijians | 98.4 /100 | #100 | Exceptional 57.6% |
| Lebanese | 98.3 /100 | #101 | Exceptional 57.6% |
| Immigrants | Bolivia | 98.2 /100 | #102 | Exceptional 57.6% |
| Jordanians | 98.2 /100 | #103 | Exceptional 57.6% |
| Immigrants | Indonesia | 98.2 /100 | #104 | Exceptional 57.6% |
| Immigrants | Korea | 98.2 /100 | #105 | Exceptional 57.6% |
| Immigrants | Oceania | 98.2 /100 | #106 | Exceptional 57.5% |
| Immigrants | Netherlands | 98.2 /100 | #107 | Exceptional 57.5% |
| Immigrants | Canada | 98.1 /100 | #108 | Exceptional 57.5% |
| Immigrants | North America | 98.1 /100 | #109 | Exceptional 57.5% |
| Japanese | 98.0 /100 | #110 | Exceptional 57.5% |
| Greeks | 98.0 /100 | #111 | Exceptional 57.5% |
| Pueblo | 98.0 /100 | #112 | Exceptional 57.5% |
| Zimbabweans | 96.9 /100 | #113 | Exceptional 57.2% |
Demographics Similar to Immigrants from South Eastern Asia by 2 or more Vehicles in Household
In terms of 2 or more vehicles in household, the demographic groups most similar to Immigrants from South Eastern Asia are Immigrants from Taiwan (59.7%, a difference of 0.25%), French (59.8%, a difference of 0.29%), Czechoslovakian (59.8%, a difference of 0.35%), Malaysian (59.8%, a difference of 0.43%), and Northern European (59.9%, a difference of 0.44%).
| Demographics | Rating | Rank | 2 or more Vehicles in Household |
| British | 100.0 /100 | #39 | Exceptional 60.0% |
| Cherokee | 100.0 /100 | #40 | Exceptional 59.9% |
| Northern Europeans | 100.0 /100 | #41 | Exceptional 59.9% |
| Malaysians | 100.0 /100 | #42 | Exceptional 59.8% |
| Czechoslovakians | 100.0 /100 | #43 | Exceptional 59.8% |
| French | 100.0 /100 | #44 | Exceptional 59.8% |
| Immigrants | Taiwan | 100.0 /100 | #45 | Exceptional 59.7% |
| Immigrants | South Eastern Asia | 100.0 /100 | #46 | Exceptional 59.6% |
| Yaqui | 99.9 /100 | #47 | Exceptional 59.3% |
| Immigrants | India | 99.9 /100 | #48 | Exceptional 59.3% |
| Belgians | 99.9 /100 | #49 | Exceptional 59.3% |
| Choctaw | 99.9 /100 | #50 | Exceptional 59.3% |
| Spaniards | 99.9 /100 | #51 | Exceptional 59.2% |
| Immigrants | Laos | 99.9 /100 | #52 | Exceptional 59.2% |
| Celtics | 99.9 /100 | #53 | Exceptional 59.2% |