Immigrants from Oceania vs Immigrants from Peru 4 or more Vehicles in Household
COMPARE
Immigrants from Oceania
Immigrants from Peru
4 or more Vehicles in Household
4 or more Vehicles in Household Comparison
Immigrants from Oceania
Immigrants from Peru
7.6%
4 OR MORE VEHICLES IN HOUSEHOLD
100.0/ 100
METRIC RATING
55th/ 347
METRIC RANK
6.4%
4 OR MORE VEHICLES IN HOUSEHOLD
59.8/ 100
METRIC RATING
165th/ 347
METRIC RANK
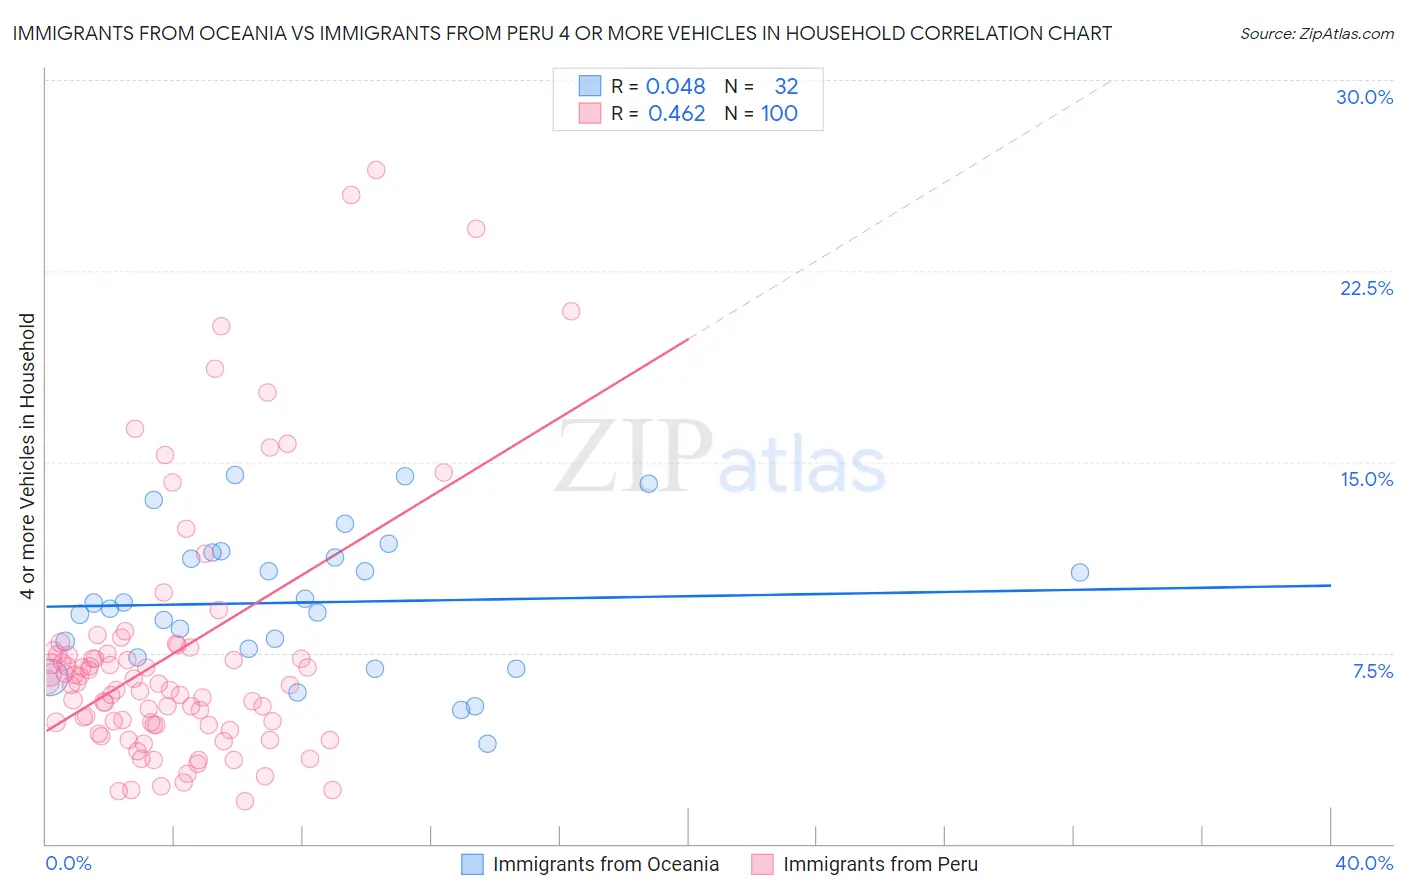
Immigrants from Oceania vs Immigrants from Peru 4 or more Vehicles in Household Correlation Chart
The statistical analysis conducted on geographies consisting of 304,187,548 people shows no correlation between the proportion of Immigrants from Oceania and percentage of households with 4 or more vehicles available in the United States with a correlation coefficient (R) of 0.048 and weighted average of 7.6%. Similarly, the statistical analysis conducted on geographies consisting of 327,444,573 people shows a moderate positive correlation between the proportion of Immigrants from Peru and percentage of households with 4 or more vehicles available in the United States with a correlation coefficient (R) of 0.462 and weighted average of 6.4%, a difference of 19.4%.
4 or more Vehicles in Household Correlation Summary
| Measurement | Immigrants from Oceania | Immigrants from Peru |
| Minimum | 3.9% | 1.7% |
| Maximum | 14.5% | 26.5% |
| Range | 10.6% | 24.8% |
| Mean | 9.5% | 7.4% |
| Median | 9.3% | 6.3% |
| Interquartile 25% (IQ1) | 7.5% | 4.7% |
| Interquartile 75% (IQ3) | 11.3% | 7.5% |
| Interquartile Range (IQR) | 3.9% | 2.8% |
| Standard Deviation (Sample) | 2.8% | 5.0% |
| Standard Deviation (Population) | 2.7% | 5.0% |
Similar Demographics by 4 or more Vehicles in Household
Demographics Similar to Immigrants from Oceania by 4 or more Vehicles in Household
In terms of 4 or more vehicles in household, the demographic groups most similar to Immigrants from Oceania are English (7.6%, a difference of 0.010%), Pennsylvania German (7.6%, a difference of 0.14%), Swedish (7.6%, a difference of 0.14%), Hispanic or Latino (7.6%, a difference of 0.17%), and Spaniard (7.6%, a difference of 0.24%).
| Demographics | Rating | Rank | 4 or more Vehicles in Household |
| Swiss | 100.0 /100 | #48 | Exceptional 7.8% |
| Cherokee | 100.0 /100 | #49 | Exceptional 7.7% |
| Immigrants | El Salvador | 100.0 /100 | #50 | Exceptional 7.7% |
| Immigrants | Laos | 100.0 /100 | #51 | Exceptional 7.7% |
| Japanese | 100.0 /100 | #52 | Exceptional 7.7% |
| Malaysians | 100.0 /100 | #53 | Exceptional 7.7% |
| Dutch | 100.0 /100 | #54 | Exceptional 7.7% |
| Immigrants | Oceania | 100.0 /100 | #55 | Exceptional 7.6% |
| English | 100.0 /100 | #56 | Exceptional 7.6% |
| Pennsylvania Germans | 100.0 /100 | #57 | Exceptional 7.6% |
| Swedes | 100.0 /100 | #58 | Exceptional 7.6% |
| Hispanics or Latinos | 100.0 /100 | #59 | Exceptional 7.6% |
| Spaniards | 100.0 /100 | #60 | Exceptional 7.6% |
| Europeans | 100.0 /100 | #61 | Exceptional 7.6% |
| Chippewa | 100.0 /100 | #62 | Exceptional 7.6% |
Demographics Similar to Immigrants from Peru by 4 or more Vehicles in Household
In terms of 4 or more vehicles in household, the demographic groups most similar to Immigrants from Peru are Chilean (6.4%, a difference of 0.14%), Hungarian (6.4%, a difference of 0.14%), Immigrants from Denmark (6.4%, a difference of 0.21%), Polish (6.4%, a difference of 0.31%), and Immigrants from Pakistan (6.4%, a difference of 0.36%).
| Demographics | Rating | Rank | 4 or more Vehicles in Household |
| Zimbabweans | 67.1 /100 | #158 | Good 6.4% |
| Indians (Asian) | 66.3 /100 | #159 | Good 6.4% |
| Palestinians | 65.8 /100 | #160 | Good 6.4% |
| Immigrants | Cameroon | 64.4 /100 | #161 | Good 6.4% |
| Immigrants | Pakistan | 63.2 /100 | #162 | Good 6.4% |
| Chileans | 61.2 /100 | #163 | Good 6.4% |
| Hungarians | 61.1 /100 | #164 | Good 6.4% |
| Immigrants | Peru | 59.8 /100 | #165 | Average 6.4% |
| Immigrants | Denmark | 57.8 /100 | #166 | Average 6.4% |
| Poles | 56.9 /100 | #167 | Average 6.4% |
| Lebanese | 55.8 /100 | #168 | Average 6.4% |
| Estonians | 55.1 /100 | #169 | Average 6.4% |
| Immigrants | Syria | 52.8 /100 | #170 | Average 6.3% |
| Immigrants | India | 51.9 /100 | #171 | Average 6.3% |
| Immigrants | Lebanon | 51.7 /100 | #172 | Average 6.3% |