Immigrants from Oceania vs Immigrants from Peru Hearing Disability
COMPARE
Immigrants from Oceania
Immigrants from Peru
Hearing Disability
Hearing Disability Comparison
Immigrants from Oceania
Immigrants from Peru
3.2%
HEARING DISABILITY
6.5/ 100
METRIC RATING
222nd/ 347
METRIC RANK
2.7%
HEARING DISABILITY
98.6/ 100
METRIC RATING
58th/ 347
METRIC RANK
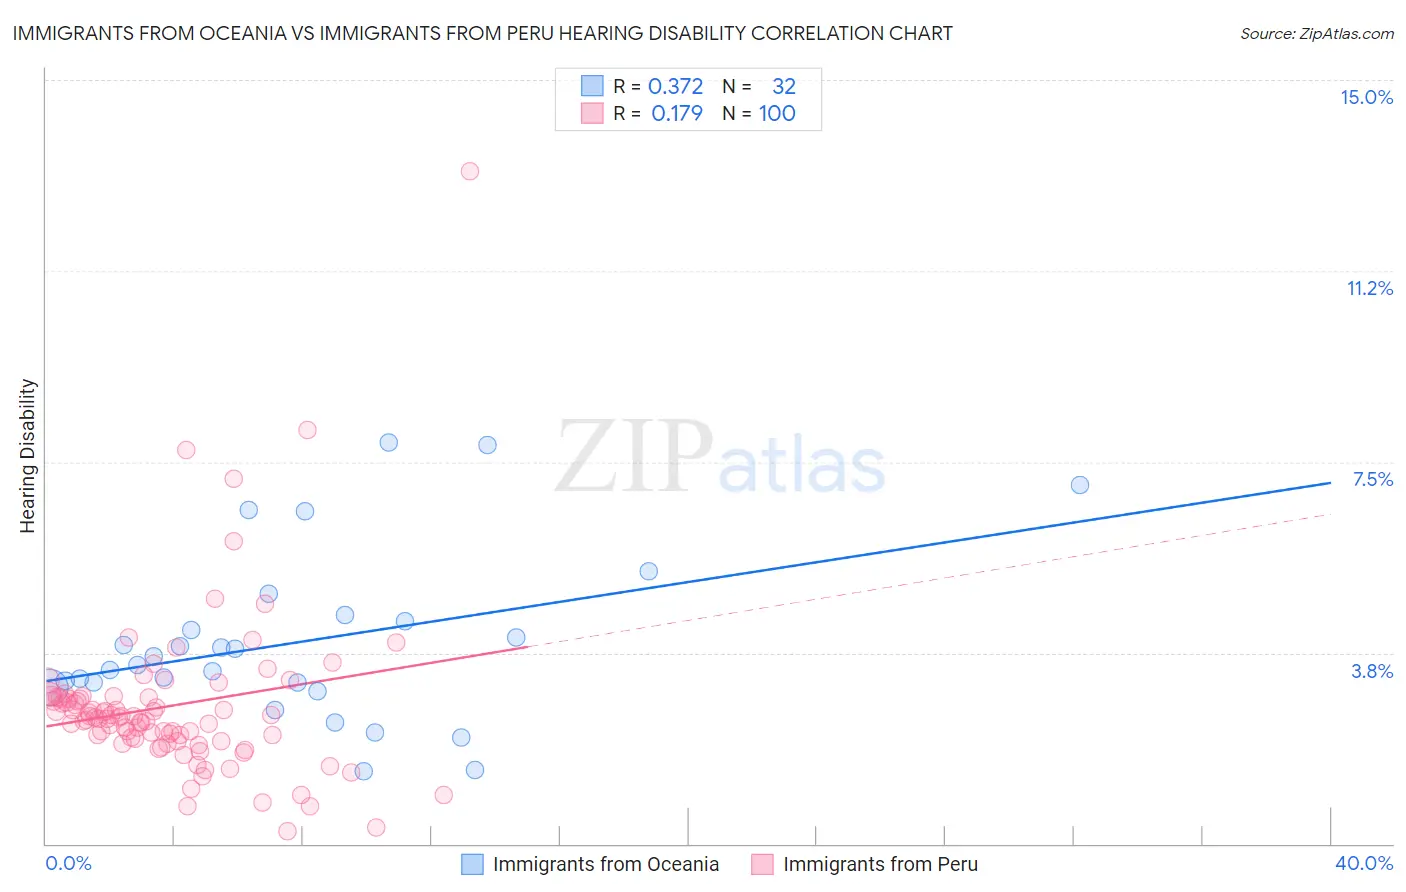
Immigrants from Oceania vs Immigrants from Peru Hearing Disability Correlation Chart
The statistical analysis conducted on geographies consisting of 305,402,457 people shows a mild positive correlation between the proportion of Immigrants from Oceania and percentage of population with hearing disability in the United States with a correlation coefficient (R) of 0.372 and weighted average of 3.2%. Similarly, the statistical analysis conducted on geographies consisting of 328,787,058 people shows a poor positive correlation between the proportion of Immigrants from Peru and percentage of population with hearing disability in the United States with a correlation coefficient (R) of 0.179 and weighted average of 2.7%, a difference of 18.0%.
Hearing Disability Correlation Summary
| Measurement | Immigrants from Oceania | Immigrants from Peru |
| Minimum | 1.4% | 0.24% |
| Maximum | 7.9% | 13.2% |
| Range | 6.5% | 13.0% |
| Mean | 4.0% | 2.7% |
| Median | 3.6% | 2.5% |
| Interquartile 25% (IQ1) | 3.1% | 2.0% |
| Interquartile 75% (IQ3) | 4.4% | 2.9% |
| Interquartile Range (IQR) | 1.3% | 0.85% |
| Standard Deviation (Sample) | 1.7% | 1.6% |
| Standard Deviation (Population) | 1.6% | 1.6% |
Similar Demographics by Hearing Disability
Demographics Similar to Immigrants from Oceania by Hearing Disability
In terms of hearing disability, the demographic groups most similar to Immigrants from Oceania are Malaysian (3.2%, a difference of 0.040%), Immigrants from Laos (3.2%, a difference of 0.040%), New Zealander (3.2%, a difference of 0.10%), Immigrants from Northern Europe (3.2%, a difference of 0.16%), and Russian (3.2%, a difference of 0.20%).
| Demographics | Rating | Rank | Hearing Disability |
| Bangladeshis | 8.1 /100 | #215 | Tragic 3.2% |
| Immigrants | Norway | 7.3 /100 | #216 | Tragic 3.2% |
| Russians | 7.1 /100 | #217 | Tragic 3.2% |
| Immigrants | Northern Europe | 7.0 /100 | #218 | Tragic 3.2% |
| New Zealanders | 6.8 /100 | #219 | Tragic 3.2% |
| Malaysians | 6.6 /100 | #220 | Tragic 3.2% |
| Immigrants | Laos | 6.6 /100 | #221 | Tragic 3.2% |
| Immigrants | Oceania | 6.5 /100 | #222 | Tragic 3.2% |
| Mexicans | 5.6 /100 | #223 | Tragic 3.2% |
| Icelanders | 5.2 /100 | #224 | Tragic 3.2% |
| Latvians | 5.1 /100 | #225 | Tragic 3.2% |
| Lebanese | 5.0 /100 | #226 | Tragic 3.2% |
| Bhutanese | 4.6 /100 | #227 | Tragic 3.2% |
| Immigrants | Portugal | 4.3 /100 | #228 | Tragic 3.2% |
| Maltese | 4.1 /100 | #229 | Tragic 3.2% |
Demographics Similar to Immigrants from Peru by Hearing Disability
In terms of hearing disability, the demographic groups most similar to Immigrants from Peru are Immigrants from Eritrea (2.7%, a difference of 0.11%), Immigrants from Egypt (2.7%, a difference of 0.18%), Immigrants from Uzbekistan (2.7%, a difference of 0.31%), Immigrants from Colombia (2.7%, a difference of 0.32%), and Indian (Asian) (2.7%, a difference of 0.37%).
| Demographics | Rating | Rank | Hearing Disability |
| Immigrants | Hong Kong | 99.2 /100 | #51 | Exceptional 2.7% |
| Jamaicans | 99.0 /100 | #52 | Exceptional 2.7% |
| Immigrants | Eastern Asia | 99.0 /100 | #53 | Exceptional 2.7% |
| Ethiopians | 99.0 /100 | #54 | Exceptional 2.7% |
| Immigrants | Ethiopia | 99.0 /100 | #55 | Exceptional 2.7% |
| Immigrants | Nicaragua | 99.0 /100 | #56 | Exceptional 2.7% |
| South Americans | 99.0 /100 | #57 | Exceptional 2.7% |
| Immigrants | Peru | 98.6 /100 | #58 | Exceptional 2.7% |
| Immigrants | Eritrea | 98.5 /100 | #59 | Exceptional 2.7% |
| Immigrants | Egypt | 98.5 /100 | #60 | Exceptional 2.7% |
| Immigrants | Uzbekistan | 98.4 /100 | #61 | Exceptional 2.7% |
| Immigrants | Colombia | 98.4 /100 | #62 | Exceptional 2.7% |
| Indians (Asian) | 98.4 /100 | #63 | Exceptional 2.7% |
| Immigrants | Sri Lanka | 98.4 /100 | #64 | Exceptional 2.7% |
| Immigrants | Nepal | 98.3 /100 | #65 | Exceptional 2.7% |