Slavic vs Immigrants from Peru 4 or more Vehicles in Household
COMPARE
Slavic
Immigrants from Peru
4 or more Vehicles in Household
4 or more Vehicles in Household Comparison
Slavs
Immigrants from Peru
6.6%
4 OR MORE VEHICLES IN HOUSEHOLD
81.6/ 100
METRIC RATING
140th/ 347
METRIC RANK
6.4%
4 OR MORE VEHICLES IN HOUSEHOLD
59.8/ 100
METRIC RATING
165th/ 347
METRIC RANK
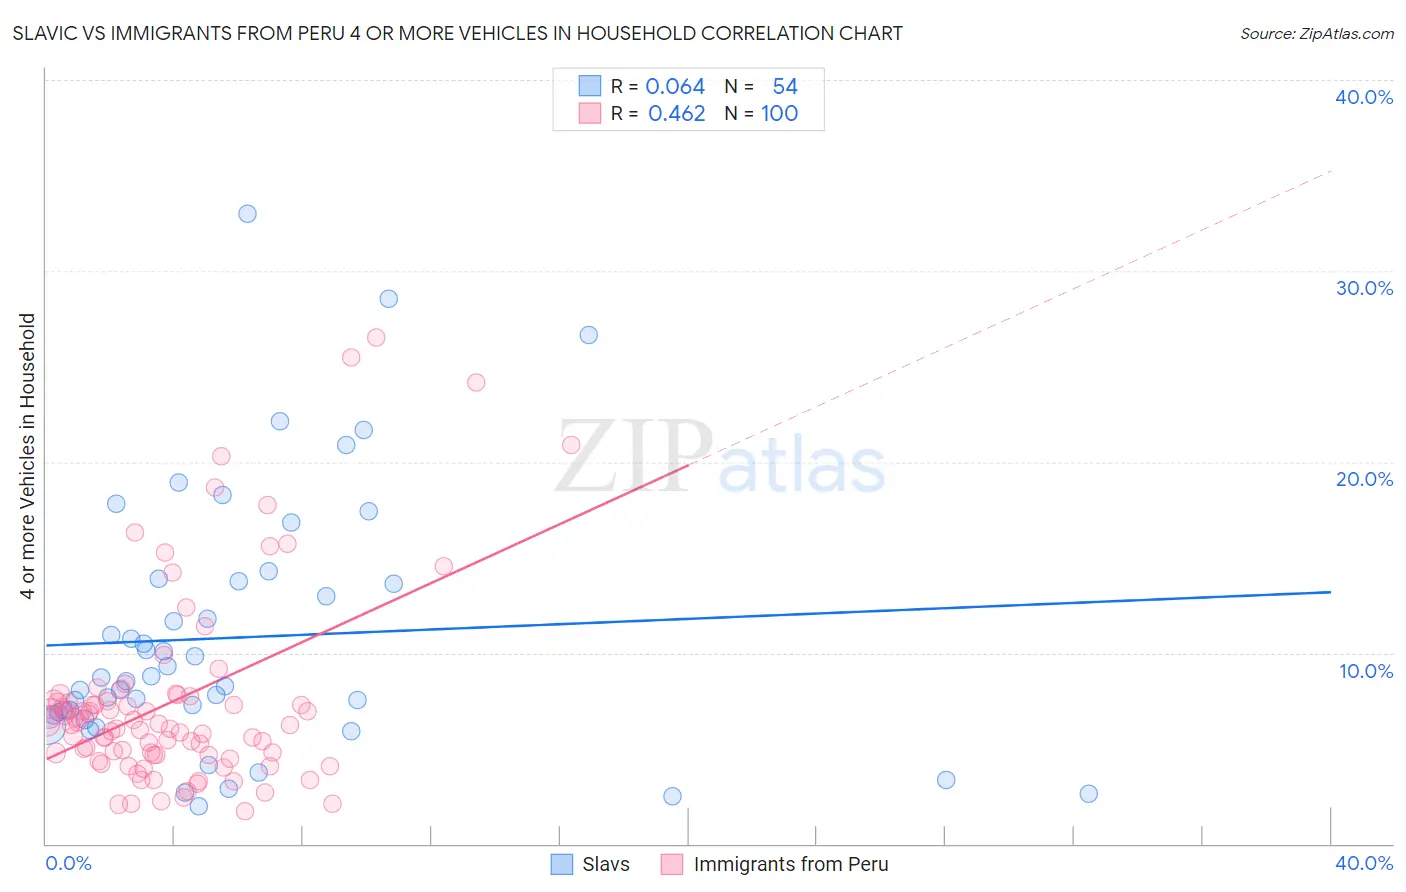
Slavic vs Immigrants from Peru 4 or more Vehicles in Household Correlation Chart
The statistical analysis conducted on geographies consisting of 270,086,100 people shows a slight positive correlation between the proportion of Slavs and percentage of households with 4 or more vehicles available in the United States with a correlation coefficient (R) of 0.064 and weighted average of 6.6%. Similarly, the statistical analysis conducted on geographies consisting of 327,444,573 people shows a moderate positive correlation between the proportion of Immigrants from Peru and percentage of households with 4 or more vehicles available in the United States with a correlation coefficient (R) of 0.462 and weighted average of 6.4%, a difference of 2.7%.
4 or more Vehicles in Household Correlation Summary
| Measurement | Slavic | Immigrants from Peru |
| Minimum | 2.0% | 1.7% |
| Maximum | 33.0% | 26.5% |
| Range | 31.0% | 24.8% |
| Mean | 10.8% | 7.4% |
| Median | 8.6% | 6.3% |
| Interquartile 25% (IQ1) | 6.7% | 4.7% |
| Interquartile 75% (IQ3) | 13.7% | 7.5% |
| Interquartile Range (IQR) | 7.0% | 2.8% |
| Standard Deviation (Sample) | 6.8% | 5.0% |
| Standard Deviation (Population) | 6.8% | 5.0% |
Similar Demographics by 4 or more Vehicles in Household
Demographics Similar to Slavs by 4 or more Vehicles in Household
In terms of 4 or more vehicles in household, the demographic groups most similar to Slavs are Jordanian (6.6%, a difference of 0.080%), Australian (6.6%, a difference of 0.13%), Immigrants from Iraq (6.5%, a difference of 0.33%), Immigrants from Canada (6.5%, a difference of 0.46%), and Immigrants from North America (6.5%, a difference of 0.48%).
| Demographics | Rating | Rank | 4 or more Vehicles in Household |
| Armenians | 86.9 /100 | #133 | Excellent 6.6% |
| Ottawa | 86.9 /100 | #134 | Excellent 6.6% |
| Tohono O'odham | 86.7 /100 | #135 | Excellent 6.6% |
| Luxembourgers | 86.4 /100 | #136 | Excellent 6.6% |
| French Canadians | 85.4 /100 | #137 | Excellent 6.6% |
| Italians | 84.5 /100 | #138 | Excellent 6.6% |
| Jordanians | 82.1 /100 | #139 | Excellent 6.6% |
| Slavs | 81.6 /100 | #140 | Excellent 6.6% |
| Australians | 80.8 /100 | #141 | Excellent 6.6% |
| Immigrants | Iraq | 79.4 /100 | #142 | Good 6.5% |
| Immigrants | Canada | 78.6 /100 | #143 | Good 6.5% |
| Immigrants | North America | 78.5 /100 | #144 | Good 6.5% |
| Croatians | 77.8 /100 | #145 | Good 6.5% |
| Immigrants | Costa Rica | 74.4 /100 | #146 | Good 6.5% |
| Immigrants | Iran | 73.9 /100 | #147 | Good 6.5% |
Demographics Similar to Immigrants from Peru by 4 or more Vehicles in Household
In terms of 4 or more vehicles in household, the demographic groups most similar to Immigrants from Peru are Chilean (6.4%, a difference of 0.14%), Hungarian (6.4%, a difference of 0.14%), Immigrants from Denmark (6.4%, a difference of 0.21%), Polish (6.4%, a difference of 0.31%), and Immigrants from Pakistan (6.4%, a difference of 0.36%).
| Demographics | Rating | Rank | 4 or more Vehicles in Household |
| Zimbabweans | 67.1 /100 | #158 | Good 6.4% |
| Indians (Asian) | 66.3 /100 | #159 | Good 6.4% |
| Palestinians | 65.8 /100 | #160 | Good 6.4% |
| Immigrants | Cameroon | 64.4 /100 | #161 | Good 6.4% |
| Immigrants | Pakistan | 63.2 /100 | #162 | Good 6.4% |
| Chileans | 61.2 /100 | #163 | Good 6.4% |
| Hungarians | 61.1 /100 | #164 | Good 6.4% |
| Immigrants | Peru | 59.8 /100 | #165 | Average 6.4% |
| Immigrants | Denmark | 57.8 /100 | #166 | Average 6.4% |
| Poles | 56.9 /100 | #167 | Average 6.4% |
| Lebanese | 55.8 /100 | #168 | Average 6.4% |
| Estonians | 55.1 /100 | #169 | Average 6.4% |
| Immigrants | Syria | 52.8 /100 | #170 | Average 6.3% |
| Immigrants | India | 51.9 /100 | #171 | Average 6.3% |
| Immigrants | Lebanon | 51.7 /100 | #172 | Average 6.3% |