Croatian vs Immigrants from Peru 4 or more Vehicles in Household
COMPARE
Croatian
Immigrants from Peru
4 or more Vehicles in Household
4 or more Vehicles in Household Comparison
Croatians
Immigrants from Peru
6.5%
4 OR MORE VEHICLES IN HOUSEHOLD
77.8/ 100
METRIC RATING
145th/ 347
METRIC RANK
6.4%
4 OR MORE VEHICLES IN HOUSEHOLD
59.8/ 100
METRIC RATING
165th/ 347
METRIC RANK
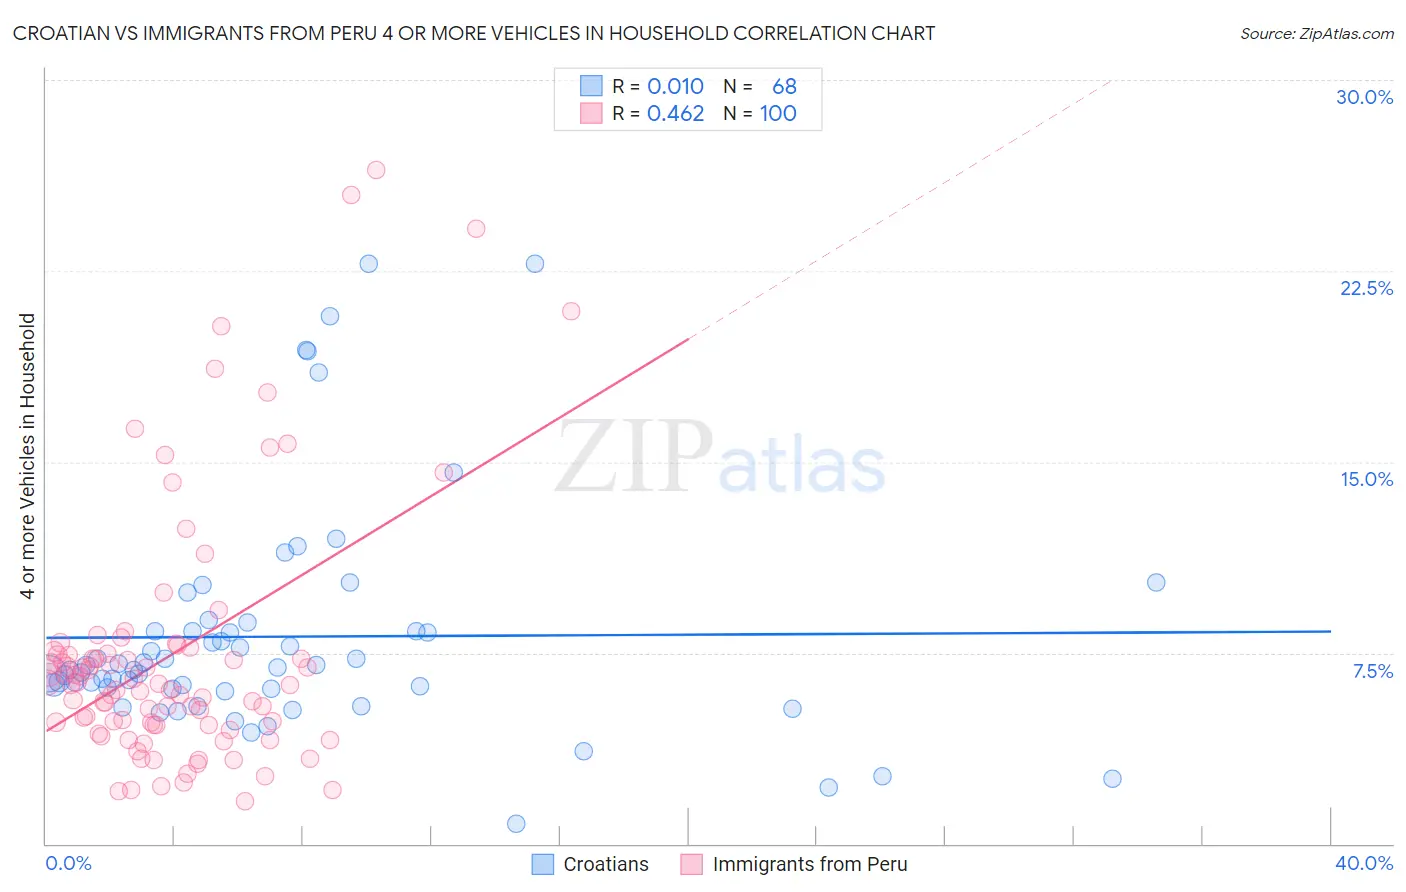
Croatian vs Immigrants from Peru 4 or more Vehicles in Household Correlation Chart
The statistical analysis conducted on geographies consisting of 374,283,631 people shows no correlation between the proportion of Croatians and percentage of households with 4 or more vehicles available in the United States with a correlation coefficient (R) of 0.010 and weighted average of 6.5%. Similarly, the statistical analysis conducted on geographies consisting of 327,444,573 people shows a moderate positive correlation between the proportion of Immigrants from Peru and percentage of households with 4 or more vehicles available in the United States with a correlation coefficient (R) of 0.462 and weighted average of 6.4%, a difference of 2.1%.
4 or more Vehicles in Household Correlation Summary
| Measurement | Croatian | Immigrants from Peru |
| Minimum | 0.78% | 1.7% |
| Maximum | 22.8% | 26.5% |
| Range | 22.0% | 24.8% |
| Mean | 8.1% | 7.4% |
| Median | 6.9% | 6.3% |
| Interquartile 25% (IQ1) | 6.1% | 4.7% |
| Interquartile 75% (IQ3) | 8.3% | 7.5% |
| Interquartile Range (IQR) | 2.3% | 2.8% |
| Standard Deviation (Sample) | 4.5% | 5.0% |
| Standard Deviation (Population) | 4.5% | 5.0% |
Demographics Similar to Croatians and Immigrants from Peru by 4 or more Vehicles in Household
In terms of 4 or more vehicles in household, the demographic groups most similar to Croatians are Immigrants from Costa Rica (6.5%, a difference of 0.46%), Immigrants from Iran (6.5%, a difference of 0.51%), Immigrants from Jordan (6.5%, a difference of 0.55%), Greek (6.5%, a difference of 0.55%), and New Zealander (6.5%, a difference of 0.60%). Similarly, the demographic groups most similar to Immigrants from Peru are Chilean (6.4%, a difference of 0.14%), Hungarian (6.4%, a difference of 0.14%), Immigrants from Pakistan (6.4%, a difference of 0.36%), Immigrants from Cameroon (6.4%, a difference of 0.49%), and Palestinian (6.4%, a difference of 0.64%).
| Demographics | Rating | Rank | 4 or more Vehicles in Household |
| Croatians | 77.8 /100 | #145 | Good 6.5% |
| Immigrants | Costa Rica | 74.4 /100 | #146 | Good 6.5% |
| Immigrants | Iran | 73.9 /100 | #147 | Good 6.5% |
| Immigrants | Jordan | 73.7 /100 | #148 | Good 6.5% |
| Greeks | 73.6 /100 | #149 | Good 6.5% |
| New Zealanders | 73.3 /100 | #150 | Good 6.5% |
| Immigrants | Hong Kong | 72.2 /100 | #151 | Good 6.5% |
| Yuman | 72.1 /100 | #152 | Good 6.5% |
| Immigrants | Armenia | 71.2 /100 | #153 | Good 6.5% |
| Central American Indians | 71.1 /100 | #154 | Good 6.5% |
| Iroquois | 70.4 /100 | #155 | Good 6.5% |
| Iranians | 69.9 /100 | #156 | Good 6.5% |
| Peruvians | 69.4 /100 | #157 | Good 6.5% |
| Zimbabweans | 67.1 /100 | #158 | Good 6.4% |
| Indians (Asian) | 66.3 /100 | #159 | Good 6.4% |
| Palestinians | 65.8 /100 | #160 | Good 6.4% |
| Immigrants | Cameroon | 64.4 /100 | #161 | Good 6.4% |
| Immigrants | Pakistan | 63.2 /100 | #162 | Good 6.4% |
| Chileans | 61.2 /100 | #163 | Good 6.4% |
| Hungarians | 61.1 /100 | #164 | Good 6.4% |
| Immigrants | Peru | 59.8 /100 | #165 | Average 6.4% |