Immigrants from Oceania vs Immigrants from Peru Child Poverty Under the Age of 5
COMPARE
Immigrants from Oceania
Immigrants from Peru
Child Poverty Under the Age of 5
Child Poverty Under the Age of 5 Comparison
Immigrants from Oceania
Immigrants from Peru
16.9%
CHILD POVERTY UNDER THE AGE OF 5
67.6/ 100
METRIC RATING
164th/ 347
METRIC RANK
16.1%
CHILD POVERTY UNDER THE AGE OF 5
92.6/ 100
METRIC RATING
120th/ 347
METRIC RANK
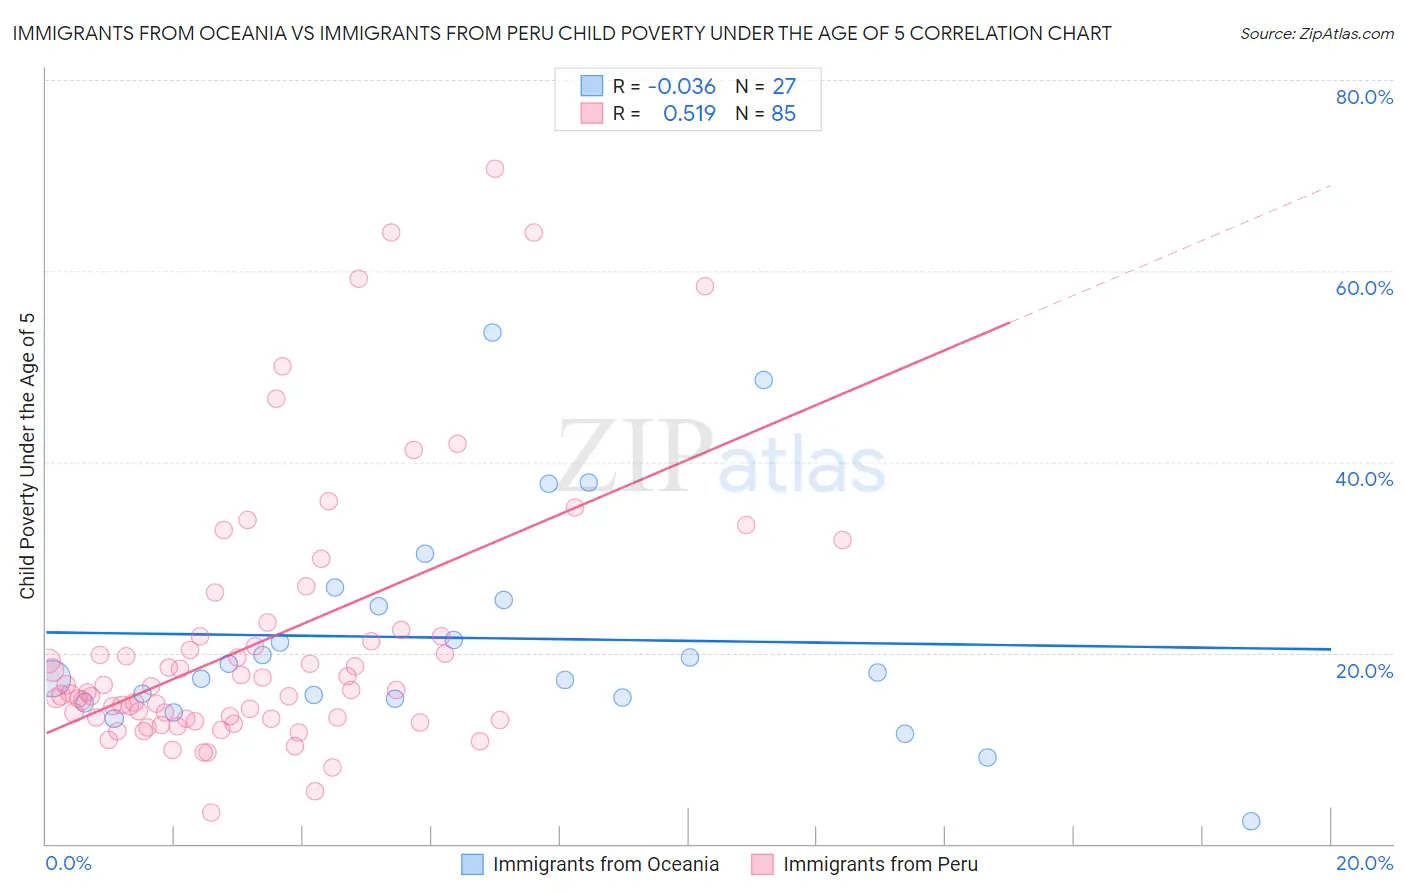
Immigrants from Oceania vs Immigrants from Peru Child Poverty Under the Age of 5 Correlation Chart
The statistical analysis conducted on geographies consisting of 294,567,604 people shows no correlation between the proportion of Immigrants from Oceania and poverty level among children under the age of 5 in the United States with a correlation coefficient (R) of -0.036 and weighted average of 16.9%. Similarly, the statistical analysis conducted on geographies consisting of 318,381,323 people shows a substantial positive correlation between the proportion of Immigrants from Peru and poverty level among children under the age of 5 in the United States with a correlation coefficient (R) of 0.519 and weighted average of 16.1%, a difference of 5.0%.
Child Poverty Under the Age of 5 Correlation Summary
| Measurement | Immigrants from Oceania | Immigrants from Peru |
| Minimum | 2.4% | 3.3% |
| Maximum | 53.5% | 70.7% |
| Range | 51.2% | 67.3% |
| Mean | 21.6% | 21.0% |
| Median | 18.0% | 16.1% |
| Interquartile 25% (IQ1) | 15.2% | 13.1% |
| Interquartile 75% (IQ3) | 25.6% | 21.7% |
| Interquartile Range (IQR) | 10.4% | 8.6% |
| Standard Deviation (Sample) | 11.5% | 13.8% |
| Standard Deviation (Population) | 11.3% | 13.7% |
Similar Demographics by Child Poverty Under the Age of 5
Demographics Similar to Immigrants from Oceania by Child Poverty Under the Age of 5
In terms of child poverty under the age of 5, the demographic groups most similar to Immigrants from Oceania are Immigrants from Colombia (16.9%, a difference of 0.090%), Scottish (16.9%, a difference of 0.12%), Costa Rican (16.9%, a difference of 0.27%), English (16.8%, a difference of 0.34%), and Slavic (17.0%, a difference of 0.43%).
| Demographics | Rating | Rank | Child Poverty Under the Age of 5 |
| Venezuelans | 73.7 /100 | #157 | Good 16.8% |
| Czechoslovakians | 72.5 /100 | #158 | Good 16.8% |
| Immigrants | Syria | 72.3 /100 | #159 | Good 16.8% |
| Irish | 72.0 /100 | #160 | Good 16.8% |
| English | 70.4 /100 | #161 | Good 16.8% |
| Costa Ricans | 69.8 /100 | #162 | Good 16.9% |
| Scottish | 68.6 /100 | #163 | Good 16.9% |
| Immigrants | Oceania | 67.6 /100 | #164 | Good 16.9% |
| Immigrants | Colombia | 66.9 /100 | #165 | Good 16.9% |
| Slavs | 64.0 /100 | #166 | Good 17.0% |
| Immigrants | Uzbekistan | 62.0 /100 | #167 | Good 17.0% |
| Uruguayans | 60.5 /100 | #168 | Good 17.0% |
| Immigrants | South America | 60.0 /100 | #169 | Good 17.1% |
| Immigrants | Western Asia | 59.2 /100 | #170 | Average 17.1% |
| Immigrants | Morocco | 58.9 /100 | #171 | Average 17.1% |
Demographics Similar to Immigrants from Peru by Child Poverty Under the Age of 5
In terms of child poverty under the age of 5, the demographic groups most similar to Immigrants from Peru are Mongolian (16.1%, a difference of 0.010%), Immigrants from Southern Europe (16.1%, a difference of 0.20%), Austrian (16.1%, a difference of 0.23%), Swiss (16.1%, a difference of 0.24%), and Immigrants from Jordan (16.1%, a difference of 0.26%).
| Demographics | Rating | Rank | Child Poverty Under the Age of 5 |
| Puget Sound Salish | 94.1 /100 | #113 | Exceptional 16.0% |
| Immigrants | Kuwait | 93.9 /100 | #114 | Exceptional 16.0% |
| Albanians | 93.8 /100 | #115 | Exceptional 16.0% |
| Immigrants | Austria | 93.5 /100 | #116 | Exceptional 16.0% |
| Basques | 93.4 /100 | #117 | Exceptional 16.0% |
| Immigrants | Denmark | 93.4 /100 | #118 | Exceptional 16.0% |
| Immigrants | Jordan | 93.2 /100 | #119 | Exceptional 16.1% |
| Immigrants | Peru | 92.6 /100 | #120 | Exceptional 16.1% |
| Mongolians | 92.5 /100 | #121 | Exceptional 16.1% |
| Immigrants | Southern Europe | 92.0 /100 | #122 | Exceptional 16.1% |
| Austrians | 92.0 /100 | #123 | Exceptional 16.1% |
| Swiss | 92.0 /100 | #124 | Exceptional 16.1% |
| Native Hawaiians | 91.8 /100 | #125 | Exceptional 16.2% |
| Immigrants | Albania | 91.8 /100 | #126 | Exceptional 16.2% |
| Immigrants | England | 91.5 /100 | #127 | Exceptional 16.2% |