Kiowa vs Immigrants from Peru 4 or more Vehicles in Household
COMPARE
Kiowa
Immigrants from Peru
4 or more Vehicles in Household
4 or more Vehicles in Household Comparison
Kiowa
Immigrants from Peru
6.2%
4 OR MORE VEHICLES IN HOUSEHOLD
34.7/ 100
METRIC RATING
188th/ 347
METRIC RANK
6.4%
4 OR MORE VEHICLES IN HOUSEHOLD
59.8/ 100
METRIC RATING
165th/ 347
METRIC RANK
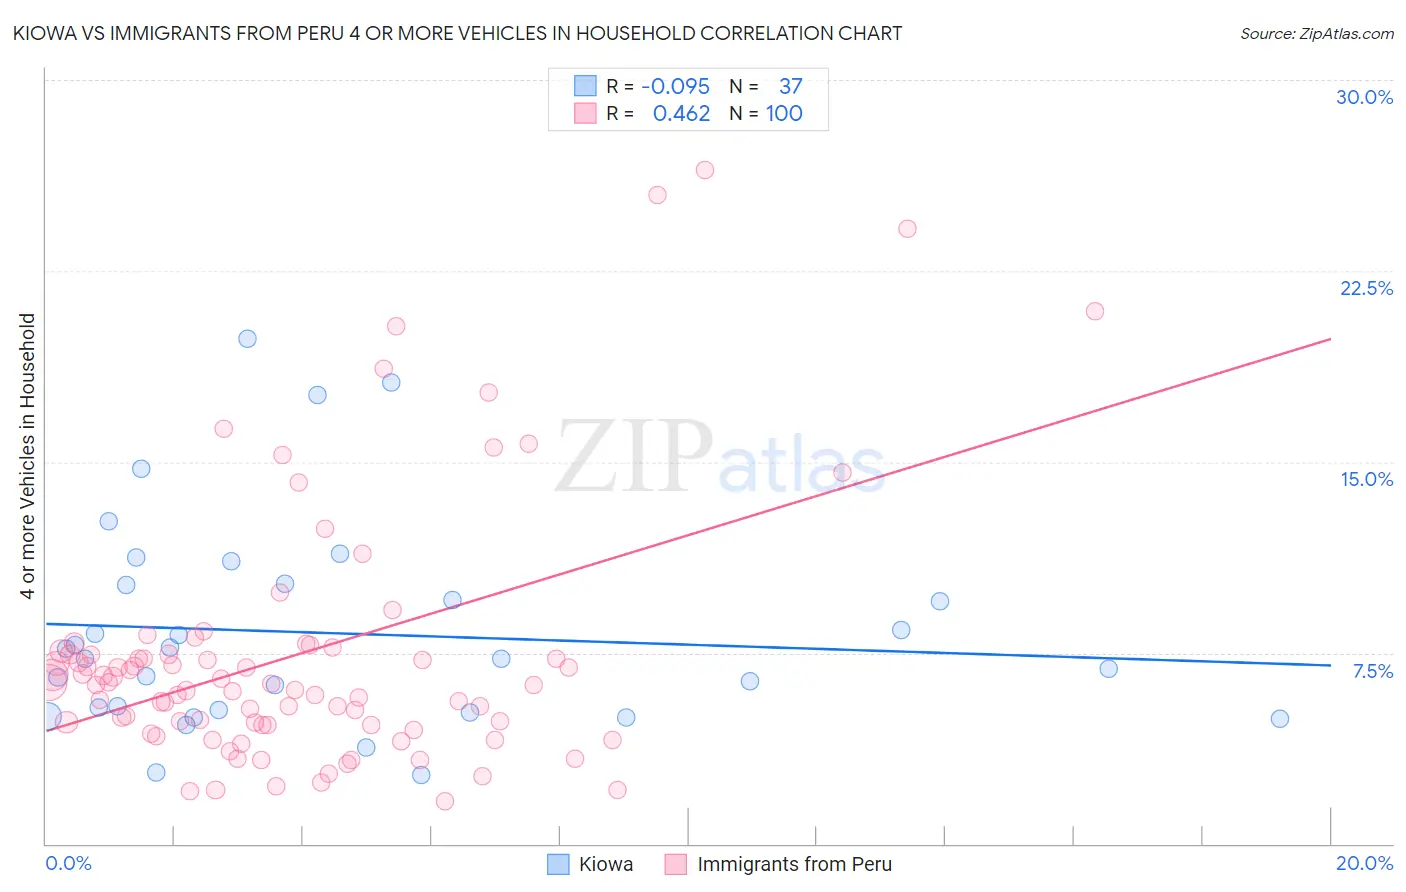
Kiowa vs Immigrants from Peru 4 or more Vehicles in Household Correlation Chart
The statistical analysis conducted on geographies consisting of 56,082,422 people shows a slight negative correlation between the proportion of Kiowa and percentage of households with 4 or more vehicles available in the United States with a correlation coefficient (R) of -0.095 and weighted average of 6.2%. Similarly, the statistical analysis conducted on geographies consisting of 327,444,573 people shows a moderate positive correlation between the proportion of Immigrants from Peru and percentage of households with 4 or more vehicles available in the United States with a correlation coefficient (R) of 0.462 and weighted average of 6.4%, a difference of 2.6%.
4 or more Vehicles in Household Correlation Summary
| Measurement | Kiowa | Immigrants from Peru |
| Minimum | 2.7% | 1.7% |
| Maximum | 19.9% | 26.5% |
| Range | 17.2% | 24.8% |
| Mean | 8.3% | 7.4% |
| Median | 7.3% | 6.3% |
| Interquartile 25% (IQ1) | 5.2% | 4.7% |
| Interquartile 75% (IQ3) | 10.2% | 7.5% |
| Interquartile Range (IQR) | 5.0% | 2.8% |
| Standard Deviation (Sample) | 4.1% | 5.0% |
| Standard Deviation (Population) | 4.1% | 5.0% |
Similar Demographics by 4 or more Vehicles in Household
Demographics Similar to Kiowa by 4 or more Vehicles in Household
In terms of 4 or more vehicles in household, the demographic groups most similar to Kiowa are Immigrants from South Africa (6.2%, a difference of 0.070%), Immigrants from Eastern Asia (6.2%, a difference of 0.17%), Immigrants from Northern Europe (6.2%, a difference of 0.23%), Thai (6.2%, a difference of 0.25%), and Iraqi (6.2%, a difference of 0.29%).
| Demographics | Rating | Rank | 4 or more Vehicles in Household |
| Yugoslavians | 41.1 /100 | #181 | Average 6.3% |
| South American Indians | 40.7 /100 | #182 | Average 6.3% |
| Immigrants | Burma/Myanmar | 37.5 /100 | #183 | Fair 6.2% |
| Iraqis | 37.3 /100 | #184 | Fair 6.2% |
| Thais | 36.9 /100 | #185 | Fair 6.2% |
| Immigrants | Northern Europe | 36.8 /100 | #186 | Fair 6.2% |
| Immigrants | South Africa | 35.4 /100 | #187 | Fair 6.2% |
| Kiowa | 34.7 /100 | #188 | Fair 6.2% |
| Immigrants | Eastern Asia | 33.3 /100 | #189 | Fair 6.2% |
| South Africans | 32.2 /100 | #190 | Fair 6.2% |
| Inupiat | 30.7 /100 | #191 | Fair 6.2% |
| Romanians | 30.7 /100 | #192 | Fair 6.2% |
| Immigrants | Kuwait | 28.0 /100 | #193 | Fair 6.2% |
| Immigrants | Sweden | 27.0 /100 | #194 | Fair 6.2% |
| Argentineans | 27.0 /100 | #195 | Fair 6.2% |
Demographics Similar to Immigrants from Peru by 4 or more Vehicles in Household
In terms of 4 or more vehicles in household, the demographic groups most similar to Immigrants from Peru are Chilean (6.4%, a difference of 0.14%), Hungarian (6.4%, a difference of 0.14%), Immigrants from Denmark (6.4%, a difference of 0.21%), Polish (6.4%, a difference of 0.31%), and Immigrants from Pakistan (6.4%, a difference of 0.36%).
| Demographics | Rating | Rank | 4 or more Vehicles in Household |
| Zimbabweans | 67.1 /100 | #158 | Good 6.4% |
| Indians (Asian) | 66.3 /100 | #159 | Good 6.4% |
| Palestinians | 65.8 /100 | #160 | Good 6.4% |
| Immigrants | Cameroon | 64.4 /100 | #161 | Good 6.4% |
| Immigrants | Pakistan | 63.2 /100 | #162 | Good 6.4% |
| Chileans | 61.2 /100 | #163 | Good 6.4% |
| Hungarians | 61.1 /100 | #164 | Good 6.4% |
| Immigrants | Peru | 59.8 /100 | #165 | Average 6.4% |
| Immigrants | Denmark | 57.8 /100 | #166 | Average 6.4% |
| Poles | 56.9 /100 | #167 | Average 6.4% |
| Lebanese | 55.8 /100 | #168 | Average 6.4% |
| Estonians | 55.1 /100 | #169 | Average 6.4% |
| Immigrants | Syria | 52.8 /100 | #170 | Average 6.3% |
| Immigrants | India | 51.9 /100 | #171 | Average 6.3% |
| Immigrants | Lebanon | 51.7 /100 | #172 | Average 6.3% |