Immigrants from Oceania vs Australian 4 or more Vehicles in Household
COMPARE
Immigrants from Oceania
Australian
4 or more Vehicles in Household
4 or more Vehicles in Household Comparison
Immigrants from Oceania
Australians
7.6%
4 OR MORE VEHICLES IN HOUSEHOLD
100.0/ 100
METRIC RATING
55th/ 347
METRIC RANK
6.6%
4 OR MORE VEHICLES IN HOUSEHOLD
80.8/ 100
METRIC RATING
141st/ 347
METRIC RANK
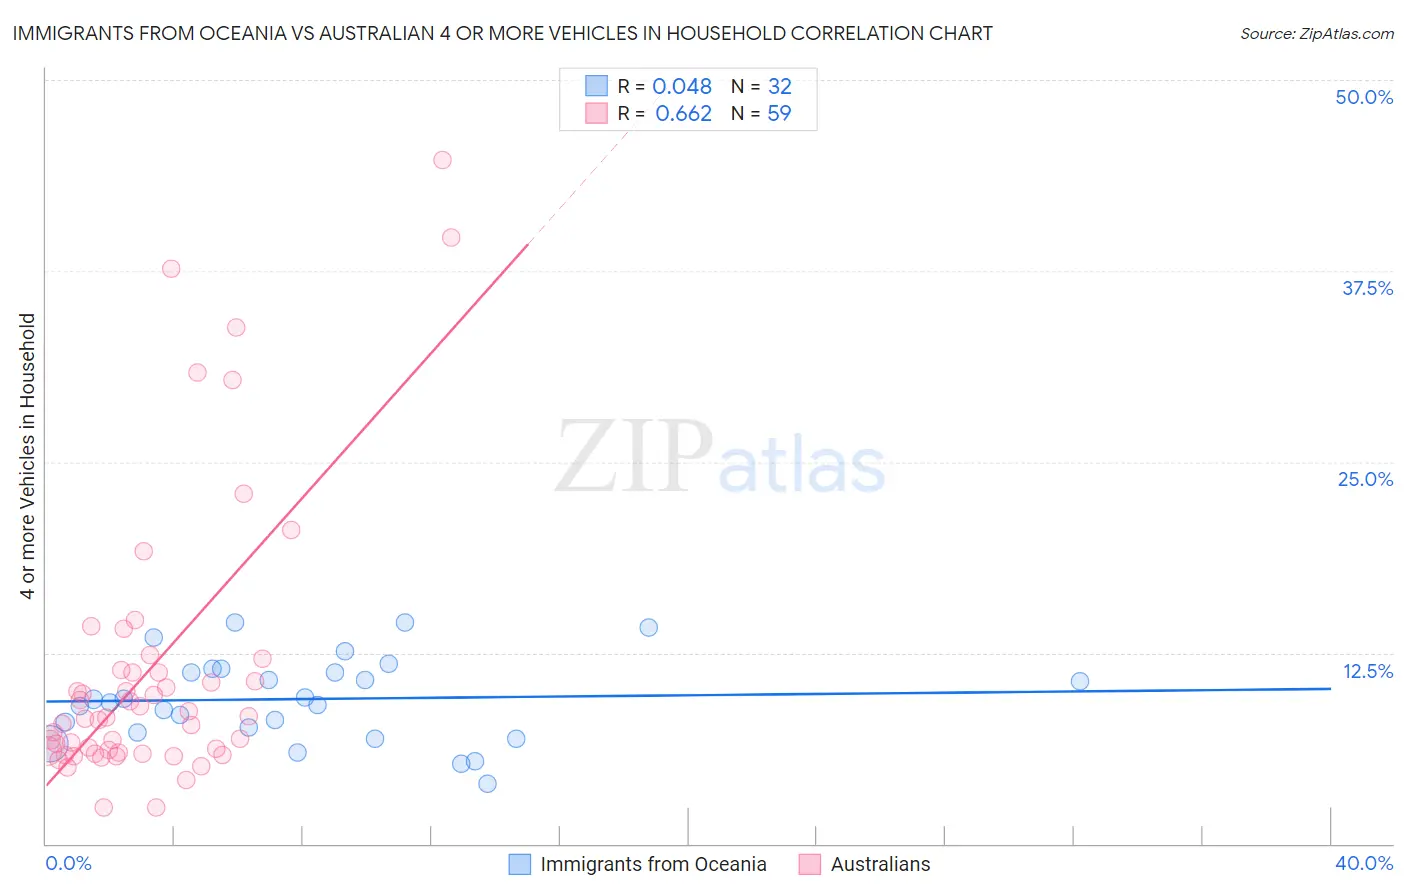
Immigrants from Oceania vs Australian 4 or more Vehicles in Household Correlation Chart
The statistical analysis conducted on geographies consisting of 304,187,548 people shows no correlation between the proportion of Immigrants from Oceania and percentage of households with 4 or more vehicles available in the United States with a correlation coefficient (R) of 0.048 and weighted average of 7.6%. Similarly, the statistical analysis conducted on geographies consisting of 223,029,698 people shows a significant positive correlation between the proportion of Australians and percentage of households with 4 or more vehicles available in the United States with a correlation coefficient (R) of 0.662 and weighted average of 6.6%, a difference of 16.4%.
4 or more Vehicles in Household Correlation Summary
| Measurement | Immigrants from Oceania | Australian |
| Minimum | 3.9% | 2.4% |
| Maximum | 14.5% | 44.7% |
| Range | 10.6% | 42.4% |
| Mean | 9.5% | 11.5% |
| Median | 9.3% | 8.3% |
| Interquartile 25% (IQ1) | 7.5% | 6.0% |
| Interquartile 75% (IQ3) | 11.3% | 11.4% |
| Interquartile Range (IQR) | 3.9% | 5.4% |
| Standard Deviation (Sample) | 2.8% | 9.4% |
| Standard Deviation (Population) | 2.7% | 9.3% |
Similar Demographics by 4 or more Vehicles in Household
Demographics Similar to Immigrants from Oceania by 4 or more Vehicles in Household
In terms of 4 or more vehicles in household, the demographic groups most similar to Immigrants from Oceania are English (7.6%, a difference of 0.010%), Pennsylvania German (7.6%, a difference of 0.14%), Swedish (7.6%, a difference of 0.14%), Hispanic or Latino (7.6%, a difference of 0.17%), and Spaniard (7.6%, a difference of 0.24%).
| Demographics | Rating | Rank | 4 or more Vehicles in Household |
| Swiss | 100.0 /100 | #48 | Exceptional 7.8% |
| Cherokee | 100.0 /100 | #49 | Exceptional 7.7% |
| Immigrants | El Salvador | 100.0 /100 | #50 | Exceptional 7.7% |
| Immigrants | Laos | 100.0 /100 | #51 | Exceptional 7.7% |
| Japanese | 100.0 /100 | #52 | Exceptional 7.7% |
| Malaysians | 100.0 /100 | #53 | Exceptional 7.7% |
| Dutch | 100.0 /100 | #54 | Exceptional 7.7% |
| Immigrants | Oceania | 100.0 /100 | #55 | Exceptional 7.6% |
| English | 100.0 /100 | #56 | Exceptional 7.6% |
| Pennsylvania Germans | 100.0 /100 | #57 | Exceptional 7.6% |
| Swedes | 100.0 /100 | #58 | Exceptional 7.6% |
| Hispanics or Latinos | 100.0 /100 | #59 | Exceptional 7.6% |
| Spaniards | 100.0 /100 | #60 | Exceptional 7.6% |
| Europeans | 100.0 /100 | #61 | Exceptional 7.6% |
| Chippewa | 100.0 /100 | #62 | Exceptional 7.6% |
Demographics Similar to Australians by 4 or more Vehicles in Household
In terms of 4 or more vehicles in household, the demographic groups most similar to Australians are Slavic (6.6%, a difference of 0.13%), Immigrants from Iraq (6.5%, a difference of 0.20%), Jordanian (6.6%, a difference of 0.21%), Immigrants from Canada (6.5%, a difference of 0.33%), and Immigrants from North America (6.5%, a difference of 0.35%).
| Demographics | Rating | Rank | 4 or more Vehicles in Household |
| Ottawa | 86.9 /100 | #134 | Excellent 6.6% |
| Tohono O'odham | 86.7 /100 | #135 | Excellent 6.6% |
| Luxembourgers | 86.4 /100 | #136 | Excellent 6.6% |
| French Canadians | 85.4 /100 | #137 | Excellent 6.6% |
| Italians | 84.5 /100 | #138 | Excellent 6.6% |
| Jordanians | 82.1 /100 | #139 | Excellent 6.6% |
| Slavs | 81.6 /100 | #140 | Excellent 6.6% |
| Australians | 80.8 /100 | #141 | Excellent 6.6% |
| Immigrants | Iraq | 79.4 /100 | #142 | Good 6.5% |
| Immigrants | Canada | 78.6 /100 | #143 | Good 6.5% |
| Immigrants | North America | 78.5 /100 | #144 | Good 6.5% |
| Croatians | 77.8 /100 | #145 | Good 6.5% |
| Immigrants | Costa Rica | 74.4 /100 | #146 | Good 6.5% |
| Immigrants | Iran | 73.9 /100 | #147 | Good 6.5% |
| Immigrants | Jordan | 73.7 /100 | #148 | Good 6.5% |