Immigrants from Oceania vs Immigrants from Eastern Africa 4 or more Vehicles in Household
COMPARE
Immigrants from Oceania
Immigrants from Eastern Africa
4 or more Vehicles in Household
4 or more Vehicles in Household Comparison
Immigrants from Oceania
Immigrants from Eastern Africa
7.6%
4 OR MORE VEHICLES IN HOUSEHOLD
100.0/ 100
METRIC RATING
55th/ 347
METRIC RANK
5.7%
4 OR MORE VEHICLES IN HOUSEHOLD
2.4/ 100
METRIC RATING
248th/ 347
METRIC RANK
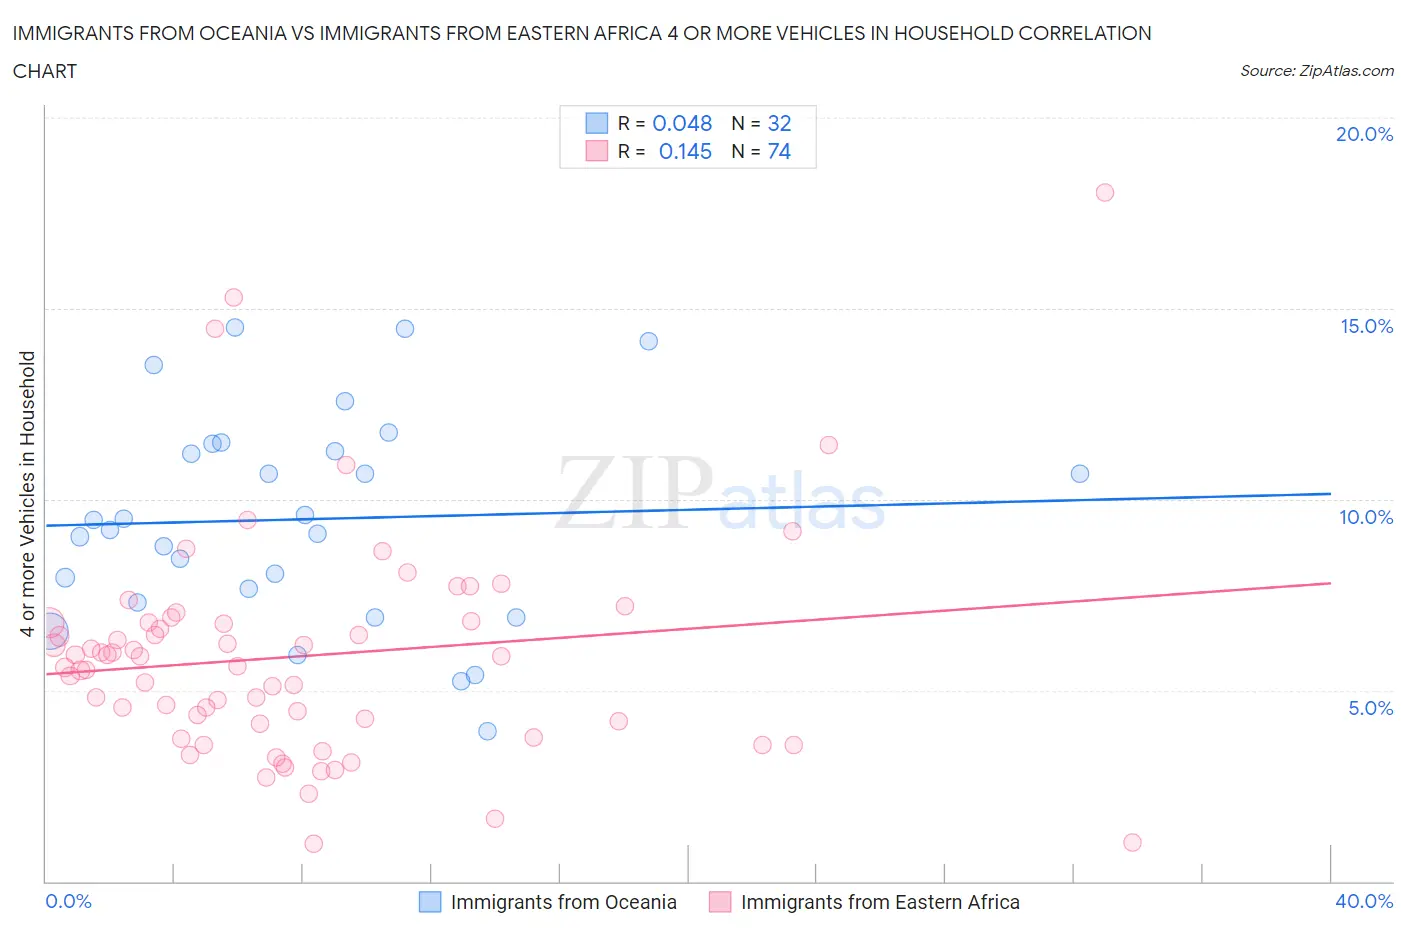
Immigrants from Oceania vs Immigrants from Eastern Africa 4 or more Vehicles in Household Correlation Chart
The statistical analysis conducted on geographies consisting of 304,187,548 people shows no correlation between the proportion of Immigrants from Oceania and percentage of households with 4 or more vehicles available in the United States with a correlation coefficient (R) of 0.048 and weighted average of 7.6%. Similarly, the statistical analysis conducted on geographies consisting of 353,455,691 people shows a poor positive correlation between the proportion of Immigrants from Eastern Africa and percentage of households with 4 or more vehicles available in the United States with a correlation coefficient (R) of 0.145 and weighted average of 5.7%, a difference of 33.1%.
4 or more Vehicles in Household Correlation Summary
| Measurement | Immigrants from Oceania | Immigrants from Eastern Africa |
| Minimum | 3.9% | 0.99% |
| Maximum | 14.5% | 18.0% |
| Range | 10.6% | 17.0% |
| Mean | 9.5% | 5.9% |
| Median | 9.3% | 5.8% |
| Interquartile 25% (IQ1) | 7.5% | 4.1% |
| Interquartile 75% (IQ3) | 11.3% | 6.8% |
| Interquartile Range (IQR) | 3.9% | 2.6% |
| Standard Deviation (Sample) | 2.8% | 2.9% |
| Standard Deviation (Population) | 2.7% | 2.9% |
Similar Demographics by 4 or more Vehicles in Household
Demographics Similar to Immigrants from Oceania by 4 or more Vehicles in Household
In terms of 4 or more vehicles in household, the demographic groups most similar to Immigrants from Oceania are English (7.6%, a difference of 0.010%), Pennsylvania German (7.6%, a difference of 0.14%), Swedish (7.6%, a difference of 0.14%), Hispanic or Latino (7.6%, a difference of 0.17%), and Spaniard (7.6%, a difference of 0.24%).
| Demographics | Rating | Rank | 4 or more Vehicles in Household |
| Swiss | 100.0 /100 | #48 | Exceptional 7.8% |
| Cherokee | 100.0 /100 | #49 | Exceptional 7.7% |
| Immigrants | El Salvador | 100.0 /100 | #50 | Exceptional 7.7% |
| Immigrants | Laos | 100.0 /100 | #51 | Exceptional 7.7% |
| Japanese | 100.0 /100 | #52 | Exceptional 7.7% |
| Malaysians | 100.0 /100 | #53 | Exceptional 7.7% |
| Dutch | 100.0 /100 | #54 | Exceptional 7.7% |
| Immigrants | Oceania | 100.0 /100 | #55 | Exceptional 7.6% |
| English | 100.0 /100 | #56 | Exceptional 7.6% |
| Pennsylvania Germans | 100.0 /100 | #57 | Exceptional 7.6% |
| Swedes | 100.0 /100 | #58 | Exceptional 7.6% |
| Hispanics or Latinos | 100.0 /100 | #59 | Exceptional 7.6% |
| Spaniards | 100.0 /100 | #60 | Exceptional 7.6% |
| Europeans | 100.0 /100 | #61 | Exceptional 7.6% |
| Chippewa | 100.0 /100 | #62 | Exceptional 7.6% |
Demographics Similar to Immigrants from Eastern Africa by 4 or more Vehicles in Household
In terms of 4 or more vehicles in household, the demographic groups most similar to Immigrants from Eastern Africa are Immigrants from Southern Europe (5.7%, a difference of 0.020%), Immigrants from Ethiopia (5.7%, a difference of 0.11%), Immigrants from Europe (5.7%, a difference of 0.12%), Immigrants from North Macedonia (5.7%, a difference of 0.14%), and Ugandan (5.7%, a difference of 0.14%).
| Demographics | Rating | Rank | 4 or more Vehicles in Household |
| Mongolians | 3.7 /100 | #241 | Tragic 5.8% |
| Immigrants | Middle Africa | 3.4 /100 | #242 | Tragic 5.8% |
| Immigrants | Czechoslovakia | 3.2 /100 | #243 | Tragic 5.8% |
| Ethiopians | 3.2 /100 | #244 | Tragic 5.8% |
| Bulgarians | 3.1 /100 | #245 | Tragic 5.8% |
| Immigrants | North Macedonia | 2.5 /100 | #246 | Tragic 5.7% |
| Immigrants | Ethiopia | 2.4 /100 | #247 | Tragic 5.7% |
| Immigrants | Eastern Africa | 2.4 /100 | #248 | Tragic 5.7% |
| Immigrants | Southern Europe | 2.3 /100 | #249 | Tragic 5.7% |
| Immigrants | Europe | 2.3 /100 | #250 | Tragic 5.7% |
| Ugandans | 2.2 /100 | #251 | Tragic 5.7% |
| Sub-Saharan Africans | 2.1 /100 | #252 | Tragic 5.7% |
| Immigrants | Cuba | 1.6 /100 | #253 | Tragic 5.7% |
| Immigrants | Panama | 1.5 /100 | #254 | Tragic 5.7% |
| Yup'ik | 1.5 /100 | #255 | Tragic 5.7% |