Immigrants from Oceania vs Romanian 4 or more Vehicles in Household
COMPARE
Immigrants from Oceania
Romanian
4 or more Vehicles in Household
4 or more Vehicles in Household Comparison
Immigrants from Oceania
Romanians
7.6%
4 OR MORE VEHICLES IN HOUSEHOLD
100.0/ 100
METRIC RATING
55th/ 347
METRIC RANK
6.2%
4 OR MORE VEHICLES IN HOUSEHOLD
30.7/ 100
METRIC RATING
192nd/ 347
METRIC RANK
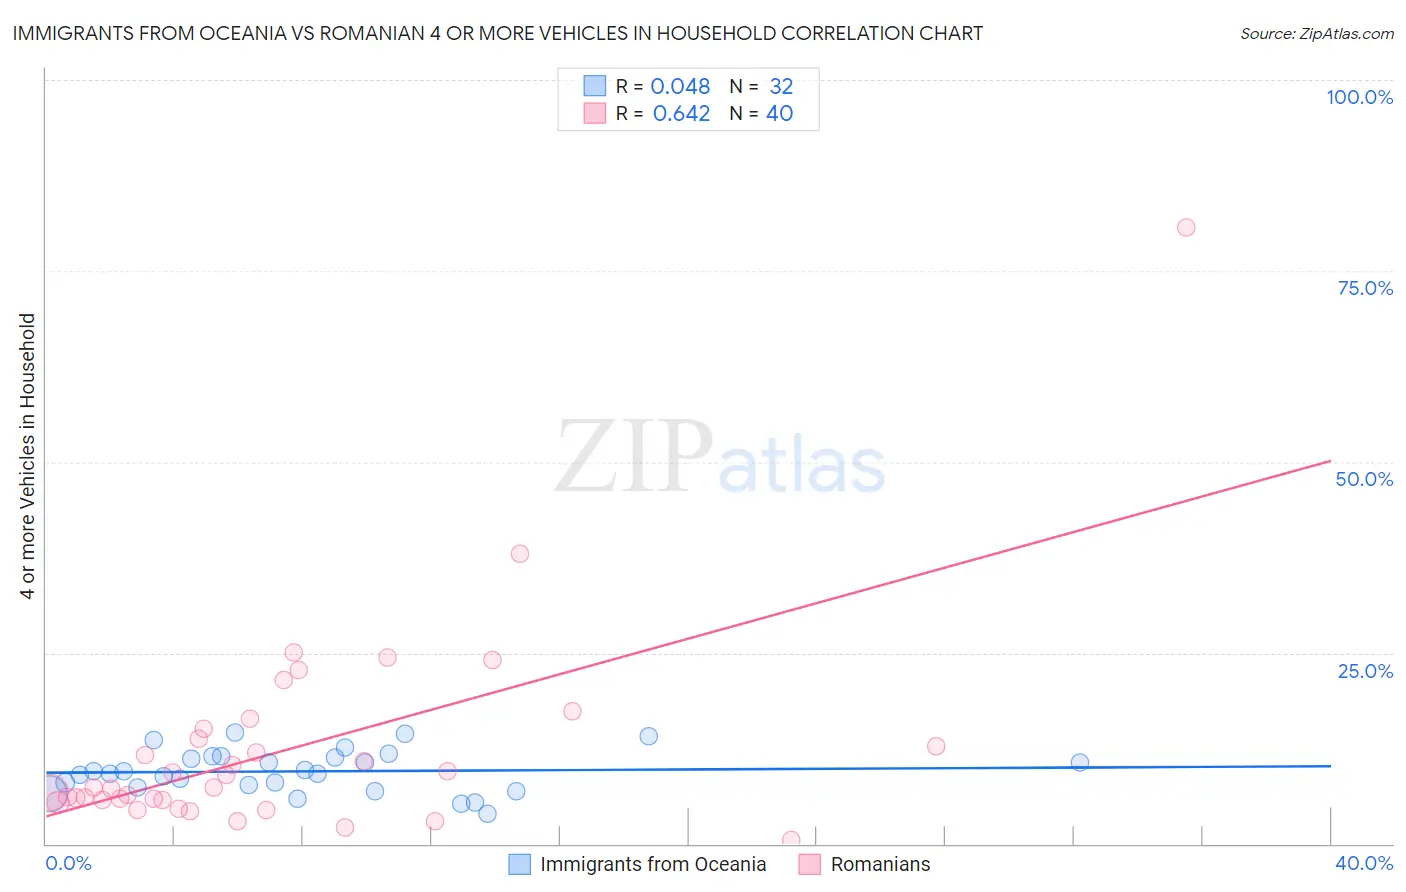
Immigrants from Oceania vs Romanian 4 or more Vehicles in Household Correlation Chart
The statistical analysis conducted on geographies consisting of 304,187,548 people shows no correlation between the proportion of Immigrants from Oceania and percentage of households with 4 or more vehicles available in the United States with a correlation coefficient (R) of 0.048 and weighted average of 7.6%. Similarly, the statistical analysis conducted on geographies consisting of 376,299,179 people shows a significant positive correlation between the proportion of Romanians and percentage of households with 4 or more vehicles available in the United States with a correlation coefficient (R) of 0.642 and weighted average of 6.2%, a difference of 23.1%.
4 or more Vehicles in Household Correlation Summary
| Measurement | Immigrants from Oceania | Romanian |
| Minimum | 3.9% | 0.45% |
| Maximum | 14.5% | 80.8% |
| Range | 10.6% | 80.3% |
| Mean | 9.5% | 12.3% |
| Median | 9.3% | 7.4% |
| Interquartile 25% (IQ1) | 7.5% | 5.8% |
| Interquartile 75% (IQ3) | 11.3% | 14.4% |
| Interquartile Range (IQR) | 3.9% | 8.6% |
| Standard Deviation (Sample) | 2.8% | 13.6% |
| Standard Deviation (Population) | 2.7% | 13.4% |
Similar Demographics by 4 or more Vehicles in Household
Demographics Similar to Immigrants from Oceania by 4 or more Vehicles in Household
In terms of 4 or more vehicles in household, the demographic groups most similar to Immigrants from Oceania are English (7.6%, a difference of 0.010%), Pennsylvania German (7.6%, a difference of 0.14%), Swedish (7.6%, a difference of 0.14%), Hispanic or Latino (7.6%, a difference of 0.17%), and Spaniard (7.6%, a difference of 0.24%).
| Demographics | Rating | Rank | 4 or more Vehicles in Household |
| Swiss | 100.0 /100 | #48 | Exceptional 7.8% |
| Cherokee | 100.0 /100 | #49 | Exceptional 7.7% |
| Immigrants | El Salvador | 100.0 /100 | #50 | Exceptional 7.7% |
| Immigrants | Laos | 100.0 /100 | #51 | Exceptional 7.7% |
| Japanese | 100.0 /100 | #52 | Exceptional 7.7% |
| Malaysians | 100.0 /100 | #53 | Exceptional 7.7% |
| Dutch | 100.0 /100 | #54 | Exceptional 7.7% |
| Immigrants | Oceania | 100.0 /100 | #55 | Exceptional 7.6% |
| English | 100.0 /100 | #56 | Exceptional 7.6% |
| Pennsylvania Germans | 100.0 /100 | #57 | Exceptional 7.6% |
| Swedes | 100.0 /100 | #58 | Exceptional 7.6% |
| Hispanics or Latinos | 100.0 /100 | #59 | Exceptional 7.6% |
| Spaniards | 100.0 /100 | #60 | Exceptional 7.6% |
| Europeans | 100.0 /100 | #61 | Exceptional 7.6% |
| Chippewa | 100.0 /100 | #62 | Exceptional 7.6% |
Demographics Similar to Romanians by 4 or more Vehicles in Household
In terms of 4 or more vehicles in household, the demographic groups most similar to Romanians are Inupiat (6.2%, a difference of 0.010%), South African (6.2%, a difference of 0.19%), Immigrants from Eastern Asia (6.2%, a difference of 0.31%), Immigrants from Kuwait (6.2%, a difference of 0.34%), and Immigrants from Sweden (6.2%, a difference of 0.47%).
| Demographics | Rating | Rank | 4 or more Vehicles in Household |
| Thais | 36.9 /100 | #185 | Fair 6.2% |
| Immigrants | Northern Europe | 36.8 /100 | #186 | Fair 6.2% |
| Immigrants | South Africa | 35.4 /100 | #187 | Fair 6.2% |
| Kiowa | 34.7 /100 | #188 | Fair 6.2% |
| Immigrants | Eastern Asia | 33.3 /100 | #189 | Fair 6.2% |
| South Africans | 32.2 /100 | #190 | Fair 6.2% |
| Inupiat | 30.7 /100 | #191 | Fair 6.2% |
| Romanians | 30.7 /100 | #192 | Fair 6.2% |
| Immigrants | Kuwait | 28.0 /100 | #193 | Fair 6.2% |
| Immigrants | Sweden | 27.0 /100 | #194 | Fair 6.2% |
| Argentineans | 27.0 /100 | #195 | Fair 6.2% |
| Tsimshian | 26.4 /100 | #196 | Fair 6.2% |
| Immigrants | Sri Lanka | 23.7 /100 | #197 | Fair 6.1% |
| Immigrants | Portugal | 22.3 /100 | #198 | Fair 6.1% |
| Immigrants | Norway | 21.8 /100 | #199 | Fair 6.1% |