Immigrants from Oceania vs Cuban 4 or more Vehicles in Household
COMPARE
Immigrants from Oceania
Cuban
4 or more Vehicles in Household
4 or more Vehicles in Household Comparison
Immigrants from Oceania
Cubans
7.6%
4 OR MORE VEHICLES IN HOUSEHOLD
100.0/ 100
METRIC RATING
55th/ 347
METRIC RANK
6.0%
4 OR MORE VEHICLES IN HOUSEHOLD
9.2/ 100
METRIC RATING
224th/ 347
METRIC RANK
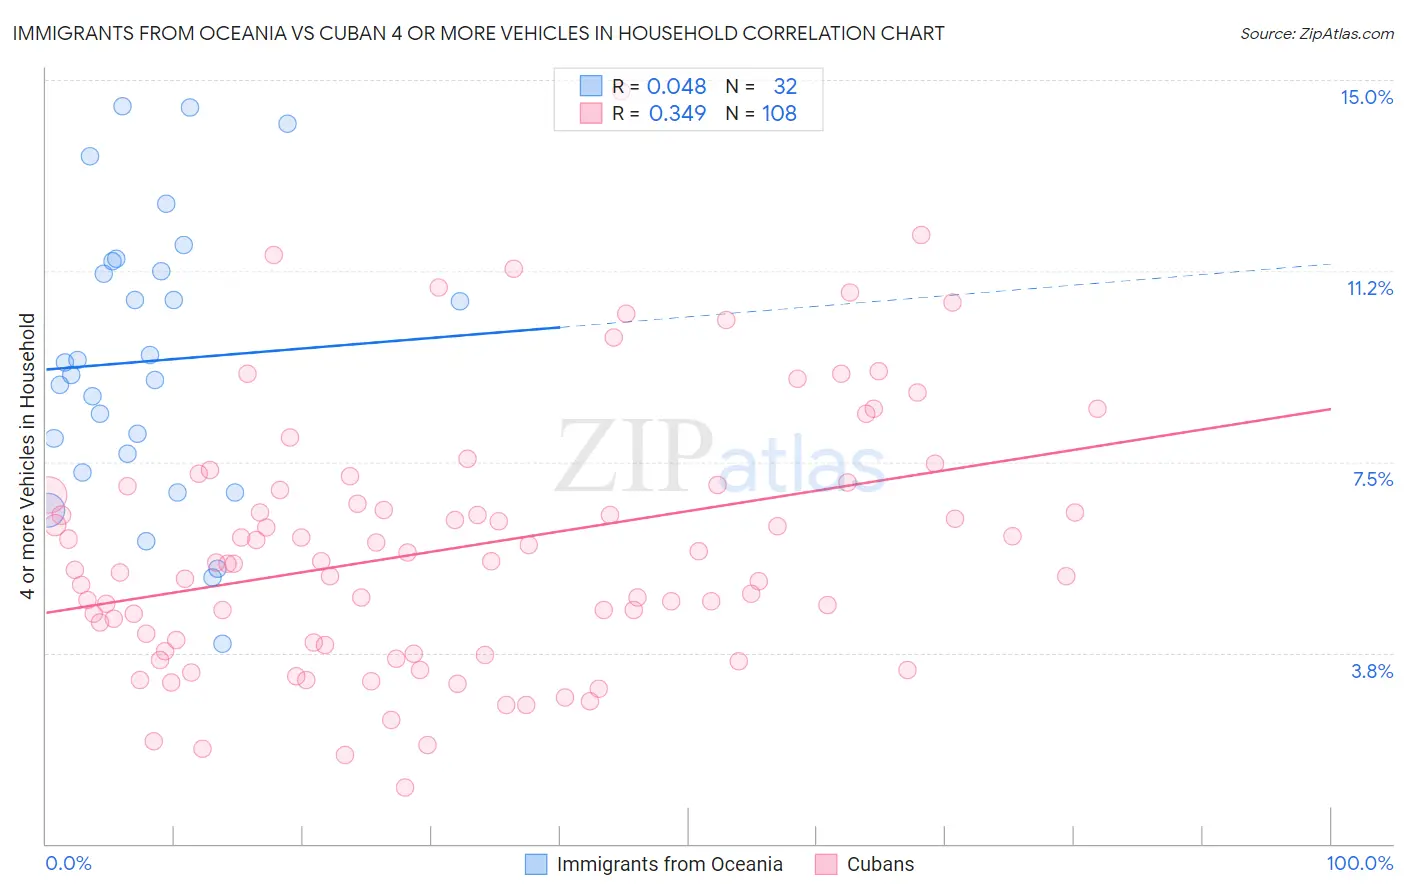
Immigrants from Oceania vs Cuban 4 or more Vehicles in Household Correlation Chart
The statistical analysis conducted on geographies consisting of 304,187,548 people shows no correlation between the proportion of Immigrants from Oceania and percentage of households with 4 or more vehicles available in the United States with a correlation coefficient (R) of 0.048 and weighted average of 7.6%. Similarly, the statistical analysis conducted on geographies consisting of 447,048,308 people shows a mild positive correlation between the proportion of Cubans and percentage of households with 4 or more vehicles available in the United States with a correlation coefficient (R) of 0.349 and weighted average of 6.0%, a difference of 28.0%.
4 or more Vehicles in Household Correlation Summary
| Measurement | Immigrants from Oceania | Cuban |
| Minimum | 3.9% | 1.1% |
| Maximum | 14.5% | 14.8% |
| Range | 10.6% | 13.7% |
| Mean | 9.5% | 5.8% |
| Median | 9.3% | 5.5% |
| Interquartile 25% (IQ1) | 7.5% | 3.9% |
| Interquartile 75% (IQ3) | 11.3% | 7.0% |
| Interquartile Range (IQR) | 3.9% | 3.0% |
| Standard Deviation (Sample) | 2.8% | 2.5% |
| Standard Deviation (Population) | 2.7% | 2.5% |
Similar Demographics by 4 or more Vehicles in Household
Demographics Similar to Immigrants from Oceania by 4 or more Vehicles in Household
In terms of 4 or more vehicles in household, the demographic groups most similar to Immigrants from Oceania are English (7.6%, a difference of 0.010%), Pennsylvania German (7.6%, a difference of 0.14%), Swedish (7.6%, a difference of 0.14%), Hispanic or Latino (7.6%, a difference of 0.17%), and Spaniard (7.6%, a difference of 0.24%).
| Demographics | Rating | Rank | 4 or more Vehicles in Household |
| Swiss | 100.0 /100 | #48 | Exceptional 7.8% |
| Cherokee | 100.0 /100 | #49 | Exceptional 7.7% |
| Immigrants | El Salvador | 100.0 /100 | #50 | Exceptional 7.7% |
| Immigrants | Laos | 100.0 /100 | #51 | Exceptional 7.7% |
| Japanese | 100.0 /100 | #52 | Exceptional 7.7% |
| Malaysians | 100.0 /100 | #53 | Exceptional 7.7% |
| Dutch | 100.0 /100 | #54 | Exceptional 7.7% |
| Immigrants | Oceania | 100.0 /100 | #55 | Exceptional 7.6% |
| English | 100.0 /100 | #56 | Exceptional 7.6% |
| Pennsylvania Germans | 100.0 /100 | #57 | Exceptional 7.6% |
| Swedes | 100.0 /100 | #58 | Exceptional 7.6% |
| Hispanics or Latinos | 100.0 /100 | #59 | Exceptional 7.6% |
| Spaniards | 100.0 /100 | #60 | Exceptional 7.6% |
| Europeans | 100.0 /100 | #61 | Exceptional 7.6% |
| Chippewa | 100.0 /100 | #62 | Exceptional 7.6% |
Demographics Similar to Cubans by 4 or more Vehicles in Household
In terms of 4 or more vehicles in household, the demographic groups most similar to Cubans are Cajun (6.0%, a difference of 0.010%), Immigrants from Kenya (6.0%, a difference of 0.010%), Immigrants from Moldova (6.0%, a difference of 0.050%), Indonesian (6.0%, a difference of 0.080%), and Russian (6.0%, a difference of 0.34%).
| Demographics | Rating | Rank | 4 or more Vehicles in Household |
| Nigerians | 12.2 /100 | #217 | Poor 6.0% |
| Immigrants | Italy | 11.0 /100 | #218 | Poor 6.0% |
| Serbians | 11.0 /100 | #219 | Poor 6.0% |
| Russians | 10.3 /100 | #220 | Poor 6.0% |
| Immigrants | Moldova | 9.3 /100 | #221 | Tragic 6.0% |
| Cajuns | 9.2 /100 | #222 | Tragic 6.0% |
| Immigrants | Kenya | 9.2 /100 | #223 | Tragic 6.0% |
| Cubans | 9.2 /100 | #224 | Tragic 6.0% |
| Indonesians | 8.9 /100 | #225 | Tragic 6.0% |
| Immigrants | Singapore | 7.9 /100 | #226 | Tragic 5.9% |
| Immigrants | Western Asia | 7.8 /100 | #227 | Tragic 5.9% |
| Immigrants | Uganda | 7.5 /100 | #228 | Tragic 5.9% |
| Eastern Europeans | 6.8 /100 | #229 | Tragic 5.9% |
| Immigrants | Malaysia | 6.7 /100 | #230 | Tragic 5.9% |
| Immigrants | Switzerland | 6.4 /100 | #231 | Tragic 5.9% |