Immigrants from Norway vs Immigrants from Israel In Labor Force | Age 20-24
COMPARE
Immigrants from Norway
Immigrants from Israel
In Labor Force | Age 20-24
In Labor Force | Age 20-24 Comparison
Immigrants from Norway
Immigrants from Israel
74.5%
IN LABOR FORCE | AGE 20-24
10.3/ 100
METRIC RATING
220th/ 347
METRIC RANK
71.6%
IN LABOR FORCE | AGE 20-24
0.0/ 100
METRIC RATING
319th/ 347
METRIC RANK
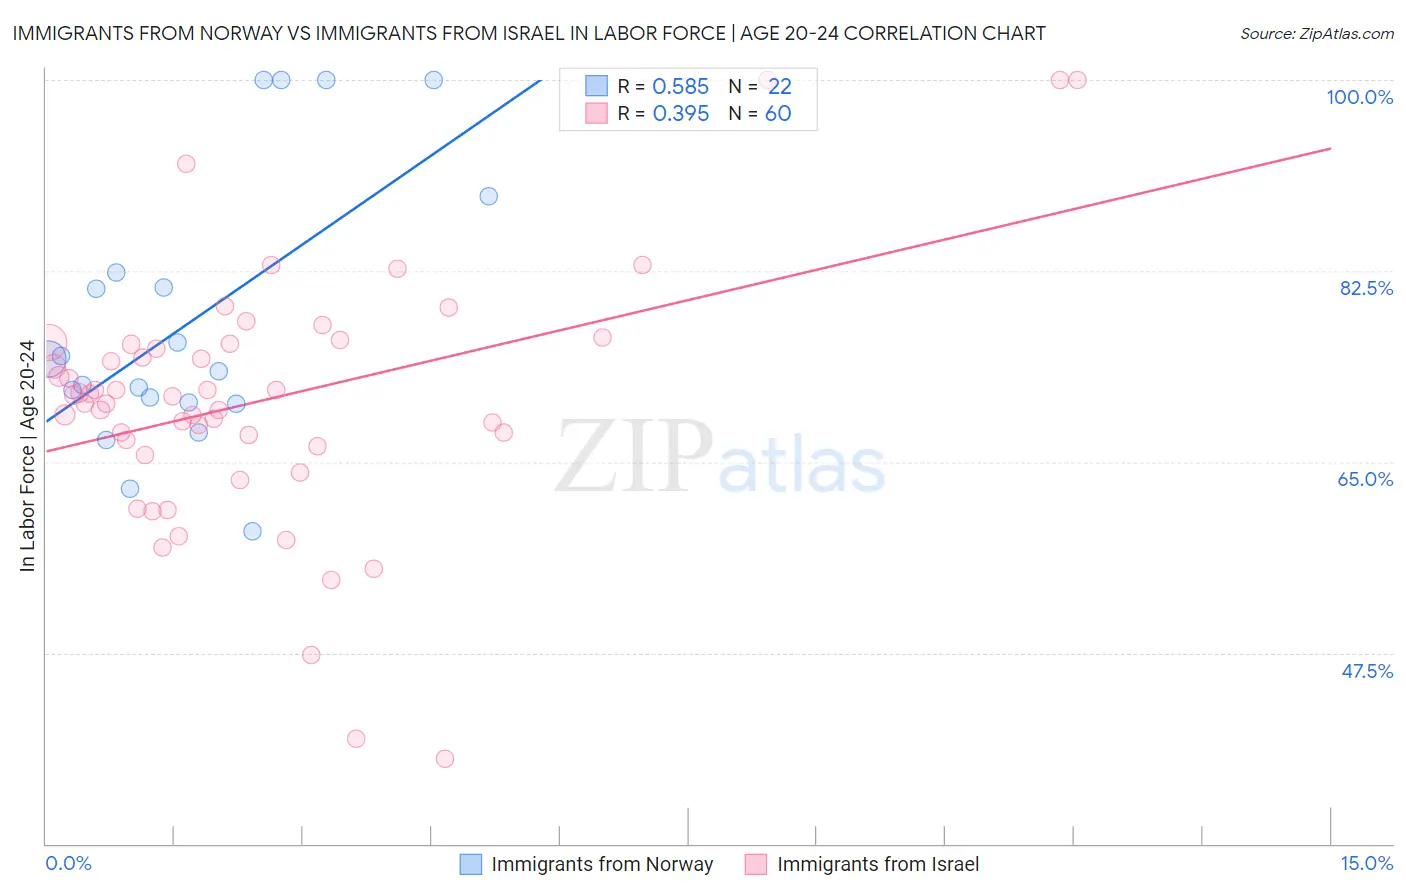
Immigrants from Norway vs Immigrants from Israel In Labor Force | Age 20-24 Correlation Chart
The statistical analysis conducted on geographies consisting of 116,699,146 people shows a substantial positive correlation between the proportion of Immigrants from Norway and labor force participation rate among population between the ages 20 and 24 in the United States with a correlation coefficient (R) of 0.585 and weighted average of 74.5%. Similarly, the statistical analysis conducted on geographies consisting of 209,940,074 people shows a mild positive correlation between the proportion of Immigrants from Israel and labor force participation rate among population between the ages 20 and 24 in the United States with a correlation coefficient (R) of 0.395 and weighted average of 71.6%, a difference of 4.0%.
In Labor Force | Age 20-24 Correlation Summary
| Measurement | Immigrants from Norway | Immigrants from Israel |
| Minimum | 58.6% | 37.8% |
| Maximum | 100.0% | 100.0% |
| Range | 41.4% | 62.2% |
| Mean | 77.9% | 70.6% |
| Median | 73.8% | 71.1% |
| Interquartile 25% (IQ1) | 70.5% | 66.7% |
| Interquartile 75% (IQ3) | 82.4% | 75.8% |
| Interquartile Range (IQR) | 11.9% | 9.1% |
| Standard Deviation (Sample) | 12.5% | 11.7% |
| Standard Deviation (Population) | 12.2% | 11.6% |
Similar Demographics by In Labor Force | Age 20-24
Demographics Similar to Immigrants from Norway by In Labor Force | Age 20-24
In terms of in labor force | age 20-24, the demographic groups most similar to Immigrants from Norway are Chickasaw (74.5%, a difference of 0.0%), Immigrants from Peru (74.5%, a difference of 0.010%), Nepalese (74.5%, a difference of 0.010%), Immigrants from India (74.4%, a difference of 0.020%), and Chilean (74.5%, a difference of 0.080%).
| Demographics | Rating | Rank | In Labor Force | Age 20-24 |
| Peruvians | 13.3 /100 | #213 | Poor 74.5% |
| Immigrants | Southern Europe | 13.2 /100 | #214 | Poor 74.5% |
| Immigrants | Ghana | 12.7 /100 | #215 | Poor 74.5% |
| Immigrants | Kuwait | 12.7 /100 | #216 | Poor 74.5% |
| Chileans | 12.5 /100 | #217 | Poor 74.5% |
| Immigrants | Peru | 10.6 /100 | #218 | Poor 74.5% |
| Nepalese | 10.5 /100 | #219 | Poor 74.5% |
| Immigrants | Norway | 10.3 /100 | #220 | Poor 74.5% |
| Chickasaw | 10.3 /100 | #221 | Poor 74.5% |
| Immigrants | India | 9.9 /100 | #222 | Tragic 74.4% |
| Hispanics or Latinos | 7.9 /100 | #223 | Tragic 74.4% |
| Seminole | 6.9 /100 | #224 | Tragic 74.3% |
| Ghanaians | 6.2 /100 | #225 | Tragic 74.3% |
| Immigrants | Fiji | 5.9 /100 | #226 | Tragic 74.3% |
| Immigrants | Ireland | 5.8 /100 | #227 | Tragic 74.3% |
Demographics Similar to Immigrants from Israel by In Labor Force | Age 20-24
In terms of in labor force | age 20-24, the demographic groups most similar to Immigrants from Israel are Immigrants from Hong Kong (71.6%, a difference of 0.030%), Trinidadian and Tobagonian (71.5%, a difference of 0.080%), Immigrants from Armenia (71.7%, a difference of 0.12%), Immigrants from Taiwan (71.5%, a difference of 0.13%), and Filipino (71.4%, a difference of 0.26%).
| Demographics | Rating | Rank | In Labor Force | Age 20-24 |
| Immigrants | Caribbean | 0.0 /100 | #312 | Tragic 71.9% |
| Immigrants | Dominica | 0.0 /100 | #313 | Tragic 71.9% |
| Indians (Asian) | 0.0 /100 | #314 | Tragic 71.9% |
| Immigrants | Iran | 0.0 /100 | #315 | Tragic 71.8% |
| Immigrants | Eastern Asia | 0.0 /100 | #316 | Tragic 71.8% |
| Immigrants | Armenia | 0.0 /100 | #317 | Tragic 71.7% |
| Immigrants | Hong Kong | 0.0 /100 | #318 | Tragic 71.6% |
| Immigrants | Israel | 0.0 /100 | #319 | Tragic 71.6% |
| Trinidadians and Tobagonians | 0.0 /100 | #320 | Tragic 71.5% |
| Immigrants | Taiwan | 0.0 /100 | #321 | Tragic 71.5% |
| Filipinos | 0.0 /100 | #322 | Tragic 71.4% |
| West Indians | 0.0 /100 | #323 | Tragic 71.3% |
| Immigrants | Dominican Republic | 0.0 /100 | #324 | Tragic 71.2% |
| Barbadians | 0.0 /100 | #325 | Tragic 71.1% |
| Dominicans | 0.0 /100 | #326 | Tragic 71.1% |