Immigrants from Middle Africa vs Immigrants from Peru Master's Degree
COMPARE
Immigrants from Middle Africa
Immigrants from Peru
Master's Degree
Master's Degree Comparison
Immigrants from Middle Africa
Immigrants from Peru
14.6%
MASTER'S DEGREE
33.6/ 100
METRIC RATING
192nd/ 347
METRIC RANK
14.9%
MASTER'S DEGREE
49.6/ 100
METRIC RATING
175th/ 347
METRIC RANK
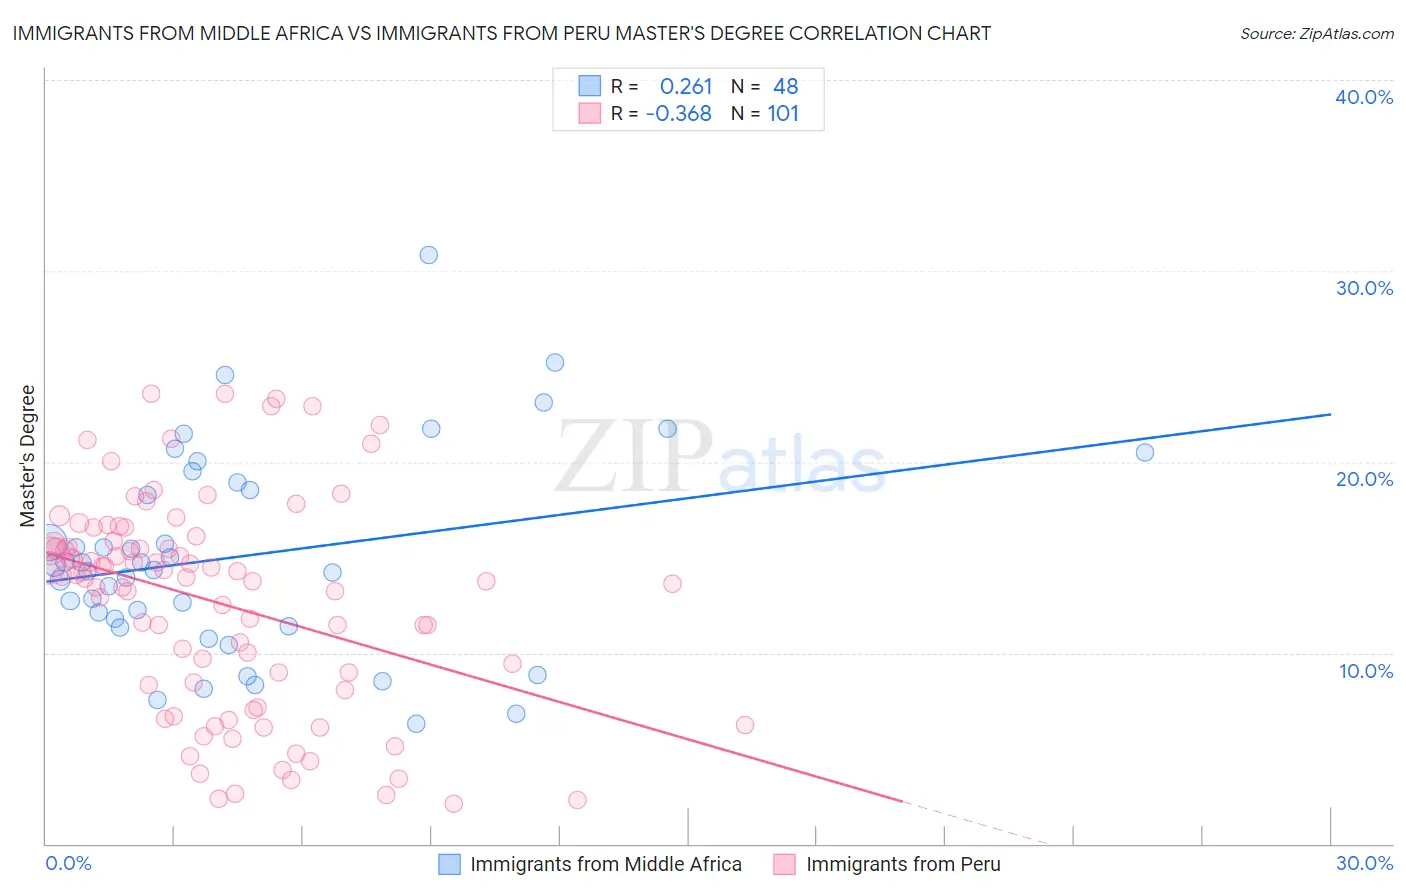
Immigrants from Middle Africa vs Immigrants from Peru Master's Degree Correlation Chart
The statistical analysis conducted on geographies consisting of 202,718,309 people shows a weak positive correlation between the proportion of Immigrants from Middle Africa and percentage of population with at least master's degree education in the United States with a correlation coefficient (R) of 0.261 and weighted average of 14.6%. Similarly, the statistical analysis conducted on geographies consisting of 328,828,935 people shows a mild negative correlation between the proportion of Immigrants from Peru and percentage of population with at least master's degree education in the United States with a correlation coefficient (R) of -0.368 and weighted average of 14.9%, a difference of 2.2%.
Master's Degree Correlation Summary
| Measurement | Immigrants from Middle Africa | Immigrants from Peru |
| Minimum | 6.3% | 2.1% |
| Maximum | 30.8% | 23.6% |
| Range | 24.5% | 21.5% |
| Mean | 15.0% | 12.6% |
| Median | 14.5% | 14.0% |
| Interquartile 25% (IQ1) | 11.6% | 8.2% |
| Interquartile 75% (IQ3) | 18.7% | 15.8% |
| Interquartile Range (IQR) | 7.1% | 7.6% |
| Standard Deviation (Sample) | 5.3% | 5.5% |
| Standard Deviation (Population) | 5.2% | 5.5% |
Demographics Similar to Immigrants from Middle Africa and Immigrants from Peru by Master's Degree
In terms of master's degree, the demographic groups most similar to Immigrants from Middle Africa are Welsh (14.6%, a difference of 0.090%), Immigrants from Nigeria (14.6%, a difference of 0.13%), Spaniard (14.6%, a difference of 0.31%), Immigrants (14.6%, a difference of 0.34%), and Immigrants from Costa Rica (14.7%, a difference of 0.37%). Similarly, the demographic groups most similar to Immigrants from Peru are Slovak (14.9%, a difference of 0.050%), Nigerian (14.9%, a difference of 0.14%), Immigrants from Colombia (14.9%, a difference of 0.17%), Costa Rican (15.0%, a difference of 0.36%), and English (14.8%, a difference of 0.61%).
| Demographics | Rating | Rank | Master's Degree |
| Costa Ricans | 52.5 /100 | #173 | Average 15.0% |
| Slovaks | 50.0 /100 | #174 | Average 14.9% |
| Immigrants | Peru | 49.6 /100 | #175 | Average 14.9% |
| Nigerians | 48.6 /100 | #176 | Average 14.9% |
| Immigrants | Colombia | 48.3 /100 | #177 | Average 14.9% |
| English | 45.0 /100 | #178 | Average 14.8% |
| Immigrants | Iraq | 41.3 /100 | #179 | Average 14.8% |
| Celtics | 41.3 /100 | #180 | Average 14.8% |
| Swiss | 41.1 /100 | #181 | Average 14.7% |
| Czechs | 40.4 /100 | #182 | Average 14.7% |
| Sri Lankans | 39.6 /100 | #183 | Fair 14.7% |
| Immigrants | Zaire | 39.5 /100 | #184 | Fair 14.7% |
| Barbadians | 38.3 /100 | #185 | Fair 14.7% |
| Immigrants | Oceania | 37.1 /100 | #186 | Fair 14.7% |
| Basques | 36.5 /100 | #187 | Fair 14.7% |
| Immigrants | Costa Rica | 36.2 /100 | #188 | Fair 14.7% |
| Immigrants | Immigrants | 36.0 /100 | #189 | Fair 14.6% |
| Spaniards | 35.8 /100 | #190 | Fair 14.6% |
| Welsh | 34.2 /100 | #191 | Fair 14.6% |
| Immigrants | Middle Africa | 33.6 /100 | #192 | Fair 14.6% |
| Immigrants | Nigeria | 32.7 /100 | #193 | Fair 14.6% |