Immigrants from Malaysia vs Welsh 3 or more Vehicles in Household
COMPARE
Immigrants from Malaysia
Welsh
3 or more Vehicles in Household
3 or more Vehicles in Household Comparison
Immigrants from Malaysia
Welsh
18.3%
3 OR MORE VEHICLES IN HOUSEHOLD
3.6/ 100
METRIC RATING
236th/ 347
METRIC RANK
22.6%
3 OR MORE VEHICLES IN HOUSEHOLD
100.0/ 100
METRIC RATING
52nd/ 347
METRIC RANK
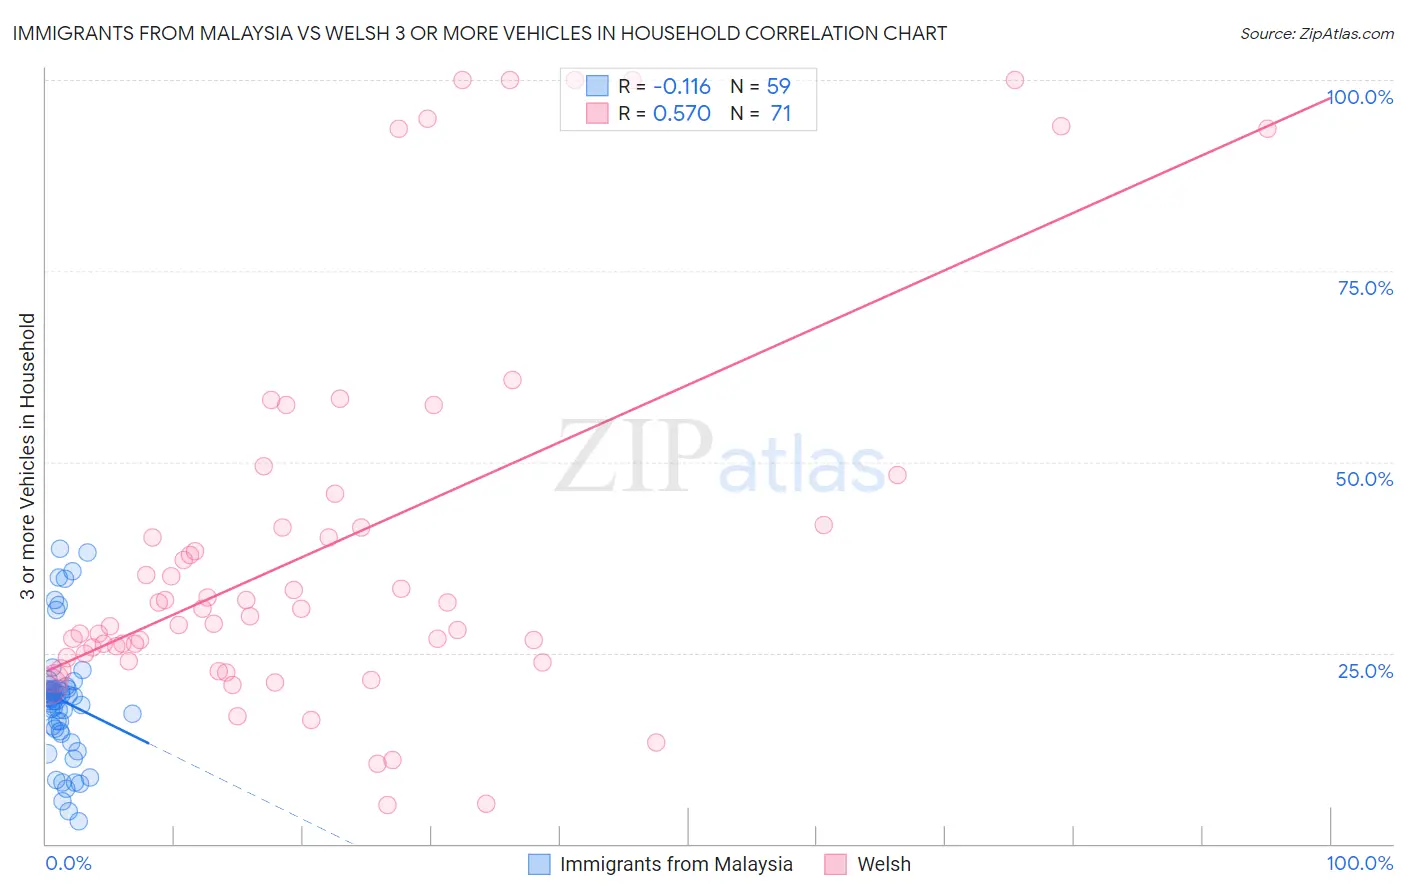
Immigrants from Malaysia vs Welsh 3 or more Vehicles in Household Correlation Chart
The statistical analysis conducted on geographies consisting of 197,846,297 people shows a poor negative correlation between the proportion of Immigrants from Malaysia and percentage of households with 3 or more vehicles available in the United States with a correlation coefficient (R) of -0.116 and weighted average of 18.3%. Similarly, the statistical analysis conducted on geographies consisting of 528,014,729 people shows a substantial positive correlation between the proportion of Welsh and percentage of households with 3 or more vehicles available in the United States with a correlation coefficient (R) of 0.570 and weighted average of 22.6%, a difference of 23.4%.
3 or more Vehicles in Household Correlation Summary
| Measurement | Immigrants from Malaysia | Welsh |
| Minimum | 3.0% | 5.1% |
| Maximum | 38.6% | 100.0% |
| Range | 35.6% | 94.9% |
| Mean | 18.7% | 39.0% |
| Median | 19.1% | 30.7% |
| Interquartile 25% (IQ1) | 14.8% | 24.3% |
| Interquartile 75% (IQ3) | 20.3% | 41.7% |
| Interquartile Range (IQR) | 5.5% | 17.3% |
| Standard Deviation (Sample) | 8.0% | 25.2% |
| Standard Deviation (Population) | 7.9% | 25.0% |
Similar Demographics by 3 or more Vehicles in Household
Demographics Similar to Immigrants from Malaysia by 3 or more Vehicles in Household
In terms of 3 or more vehicles in household, the demographic groups most similar to Immigrants from Malaysia are Indonesian (18.3%, a difference of 0.040%), Sierra Leonean (18.3%, a difference of 0.18%), Immigrants from Honduras (18.2%, a difference of 0.28%), Immigrants from Middle Africa (18.2%, a difference of 0.28%), and Immigrants from China (18.2%, a difference of 0.41%).
| Demographics | Rating | Rank | 3 or more Vehicles in Household |
| Immigrants | Switzerland | 5.0 /100 | #229 | Tragic 18.4% |
| Immigrants | Western Asia | 4.8 /100 | #230 | Tragic 18.4% |
| Immigrants | Belgium | 4.8 /100 | #231 | Tragic 18.4% |
| Immigrants | Uganda | 4.6 /100 | #232 | Tragic 18.4% |
| Hondurans | 4.6 /100 | #233 | Tragic 18.4% |
| Immigrants | North Macedonia | 4.4 /100 | #234 | Tragic 18.4% |
| Sierra Leoneans | 3.9 /100 | #235 | Tragic 18.3% |
| Immigrants | Malaysia | 3.6 /100 | #236 | Tragic 18.3% |
| Indonesians | 3.5 /100 | #237 | Tragic 18.3% |
| Immigrants | Honduras | 3.1 /100 | #238 | Tragic 18.2% |
| Immigrants | Middle Africa | 3.1 /100 | #239 | Tragic 18.2% |
| Immigrants | China | 2.9 /100 | #240 | Tragic 18.2% |
| Africans | 2.7 /100 | #241 | Tragic 18.2% |
| Hopi | 2.5 /100 | #242 | Tragic 18.2% |
| Immigrants | Europe | 2.4 /100 | #243 | Tragic 18.1% |
Demographics Similar to Welsh by 3 or more Vehicles in Household
In terms of 3 or more vehicles in household, the demographic groups most similar to Welsh are White/Caucasian (22.6%, a difference of 0.040%), Sioux (22.6%, a difference of 0.050%), Scotch-Irish (22.6%, a difference of 0.11%), Scottish (22.6%, a difference of 0.21%), and Malaysian (22.6%, a difference of 0.22%).
| Demographics | Rating | Rank | 3 or more Vehicles in Household |
| Ute | 100.0 /100 | #45 | Exceptional 22.7% |
| Americans | 100.0 /100 | #46 | Exceptional 22.6% |
| Malaysians | 100.0 /100 | #47 | Exceptional 22.6% |
| Scottish | 100.0 /100 | #48 | Exceptional 22.6% |
| Scotch-Irish | 100.0 /100 | #49 | Exceptional 22.6% |
| Sioux | 100.0 /100 | #50 | Exceptional 22.6% |
| Whites/Caucasians | 100.0 /100 | #51 | Exceptional 22.6% |
| Welsh | 100.0 /100 | #52 | Exceptional 22.6% |
| Czechs | 100.0 /100 | #53 | Exceptional 22.5% |
| Crow | 100.0 /100 | #54 | Exceptional 22.5% |
| Immigrants | Laos | 100.0 /100 | #55 | Exceptional 22.4% |
| Hispanics or Latinos | 100.0 /100 | #56 | Exceptional 22.4% |
| Pennsylvania Germans | 100.0 /100 | #57 | Exceptional 22.3% |
| Spaniards | 100.0 /100 | #58 | Exceptional 22.3% |
| Navajo | 100.0 /100 | #59 | Exceptional 22.3% |