Immigrants from Malaysia vs Danish 3 or more Vehicles in Household
COMPARE
Immigrants from Malaysia
Danish
3 or more Vehicles in Household
3 or more Vehicles in Household Comparison
Immigrants from Malaysia
Danes
18.3%
3 OR MORE VEHICLES IN HOUSEHOLD
3.6/ 100
METRIC RATING
236th/ 347
METRIC RANK
24.7%
3 OR MORE VEHICLES IN HOUSEHOLD
100.0/ 100
METRIC RATING
12th/ 347
METRIC RANK
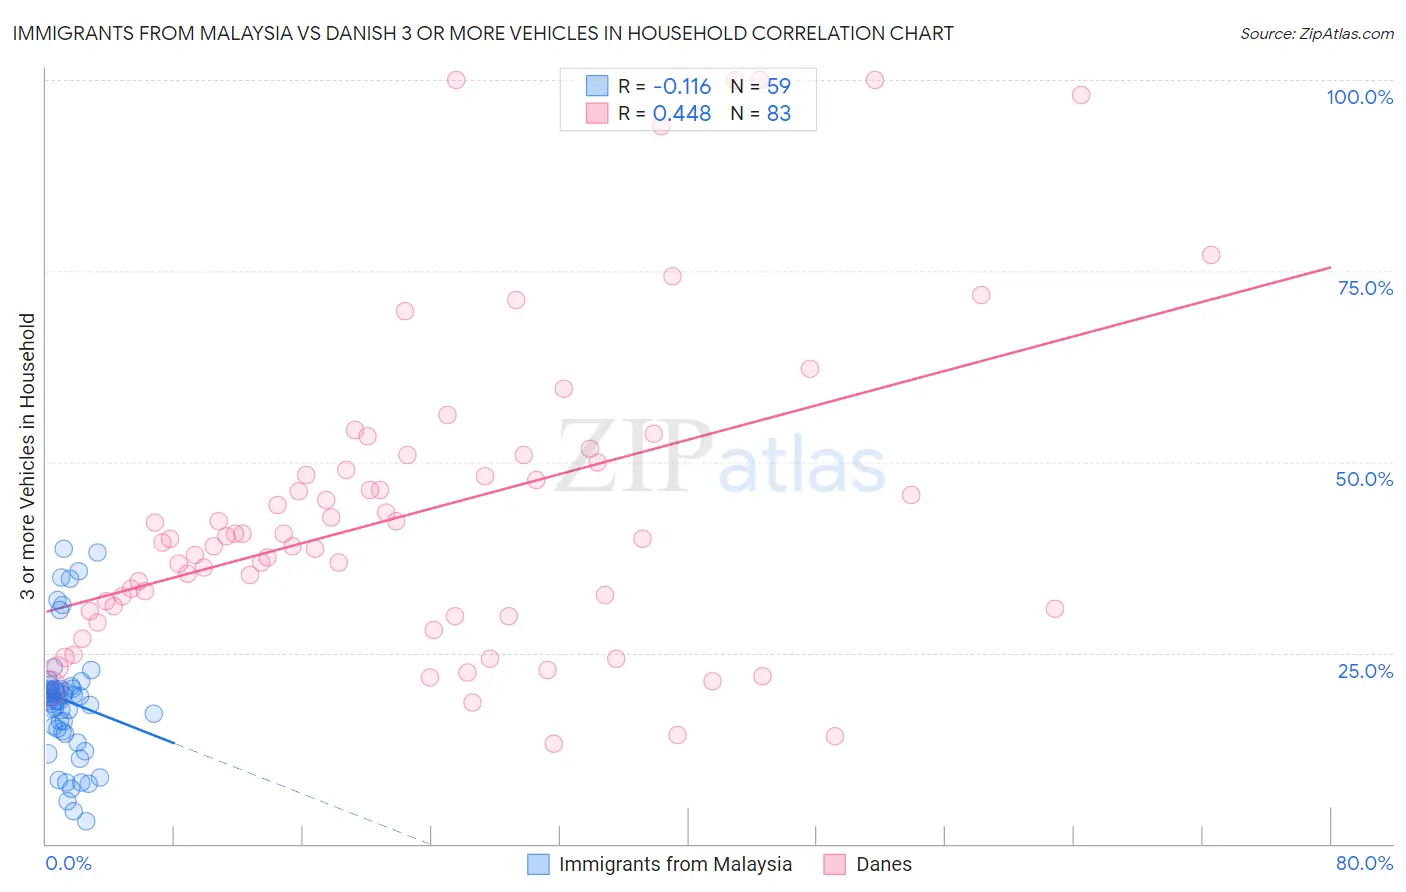
Immigrants from Malaysia vs Danish 3 or more Vehicles in Household Correlation Chart
The statistical analysis conducted on geographies consisting of 197,846,297 people shows a poor negative correlation between the proportion of Immigrants from Malaysia and percentage of households with 3 or more vehicles available in the United States with a correlation coefficient (R) of -0.116 and weighted average of 18.3%. Similarly, the statistical analysis conducted on geographies consisting of 473,746,883 people shows a moderate positive correlation between the proportion of Danes and percentage of households with 3 or more vehicles available in the United States with a correlation coefficient (R) of 0.448 and weighted average of 24.7%, a difference of 35.2%.
3 or more Vehicles in Household Correlation Summary
| Measurement | Immigrants from Malaysia | Danish |
| Minimum | 3.0% | 13.0% |
| Maximum | 38.6% | 100.0% |
| Range | 35.6% | 87.0% |
| Mean | 18.7% | 43.5% |
| Median | 19.1% | 40.0% |
| Interquartile 25% (IQ1) | 14.8% | 30.5% |
| Interquartile 75% (IQ3) | 20.3% | 50.0% |
| Interquartile Range (IQR) | 5.5% | 19.5% |
| Standard Deviation (Sample) | 8.0% | 20.6% |
| Standard Deviation (Population) | 7.9% | 20.5% |
Similar Demographics by 3 or more Vehicles in Household
Demographics Similar to Immigrants from Malaysia by 3 or more Vehicles in Household
In terms of 3 or more vehicles in household, the demographic groups most similar to Immigrants from Malaysia are Indonesian (18.3%, a difference of 0.040%), Sierra Leonean (18.3%, a difference of 0.18%), Immigrants from Honduras (18.2%, a difference of 0.28%), Immigrants from Middle Africa (18.2%, a difference of 0.28%), and Immigrants from China (18.2%, a difference of 0.41%).
| Demographics | Rating | Rank | 3 or more Vehicles in Household |
| Immigrants | Switzerland | 5.0 /100 | #229 | Tragic 18.4% |
| Immigrants | Western Asia | 4.8 /100 | #230 | Tragic 18.4% |
| Immigrants | Belgium | 4.8 /100 | #231 | Tragic 18.4% |
| Immigrants | Uganda | 4.6 /100 | #232 | Tragic 18.4% |
| Hondurans | 4.6 /100 | #233 | Tragic 18.4% |
| Immigrants | North Macedonia | 4.4 /100 | #234 | Tragic 18.4% |
| Sierra Leoneans | 3.9 /100 | #235 | Tragic 18.3% |
| Immigrants | Malaysia | 3.6 /100 | #236 | Tragic 18.3% |
| Indonesians | 3.5 /100 | #237 | Tragic 18.3% |
| Immigrants | Honduras | 3.1 /100 | #238 | Tragic 18.2% |
| Immigrants | Middle Africa | 3.1 /100 | #239 | Tragic 18.2% |
| Immigrants | China | 2.9 /100 | #240 | Tragic 18.2% |
| Africans | 2.7 /100 | #241 | Tragic 18.2% |
| Hopi | 2.5 /100 | #242 | Tragic 18.2% |
| Immigrants | Europe | 2.4 /100 | #243 | Tragic 18.1% |
Demographics Similar to Danes by 3 or more Vehicles in Household
In terms of 3 or more vehicles in household, the demographic groups most similar to Danes are Mexican (24.7%, a difference of 0.080%), Immigrants from Mexico (24.6%, a difference of 0.52%), Shoshone (24.9%, a difference of 0.69%), Nepalese (24.9%, a difference of 0.79%), and Native Hawaiian (24.9%, a difference of 0.88%).
| Demographics | Rating | Rank | 3 or more Vehicles in Household |
| Puget Sound Salish | 100.0 /100 | #5 | Exceptional 26.4% |
| Immigrants | Fiji | 100.0 /100 | #6 | Exceptional 26.1% |
| Colville | 100.0 /100 | #7 | Exceptional 25.8% |
| Samoans | 100.0 /100 | #8 | Exceptional 25.0% |
| Native Hawaiians | 100.0 /100 | #9 | Exceptional 24.9% |
| Nepalese | 100.0 /100 | #10 | Exceptional 24.9% |
| Shoshone | 100.0 /100 | #11 | Exceptional 24.9% |
| Danes | 100.0 /100 | #12 | Exceptional 24.7% |
| Mexicans | 100.0 /100 | #13 | Exceptional 24.7% |
| Immigrants | Mexico | 100.0 /100 | #14 | Exceptional 24.6% |
| Hawaiians | 100.0 /100 | #15 | Exceptional 24.3% |
| Basques | 100.0 /100 | #16 | Exceptional 24.3% |
| Koreans | 100.0 /100 | #17 | Exceptional 24.1% |
| Norwegians | 100.0 /100 | #18 | Exceptional 23.9% |
| Chinese | 100.0 /100 | #19 | Exceptional 23.9% |