Immigrants from Belize vs Immigrants from Denmark 2 or more Vehicles in Household
COMPARE
Immigrants from Belize
Immigrants from Denmark
2 or more Vehicles in Household
2 or more Vehicles in Household Comparison
Immigrants from Belize
Immigrants from Denmark
49.9%
2 OR MORE VEHICLES IN HOUSEHOLD
0.0/ 100
METRIC RATING
304th/ 347
METRIC RANK
55.3%
2 OR MORE VEHICLES IN HOUSEHOLD
49.4/ 100
METRIC RATING
175th/ 347
METRIC RANK
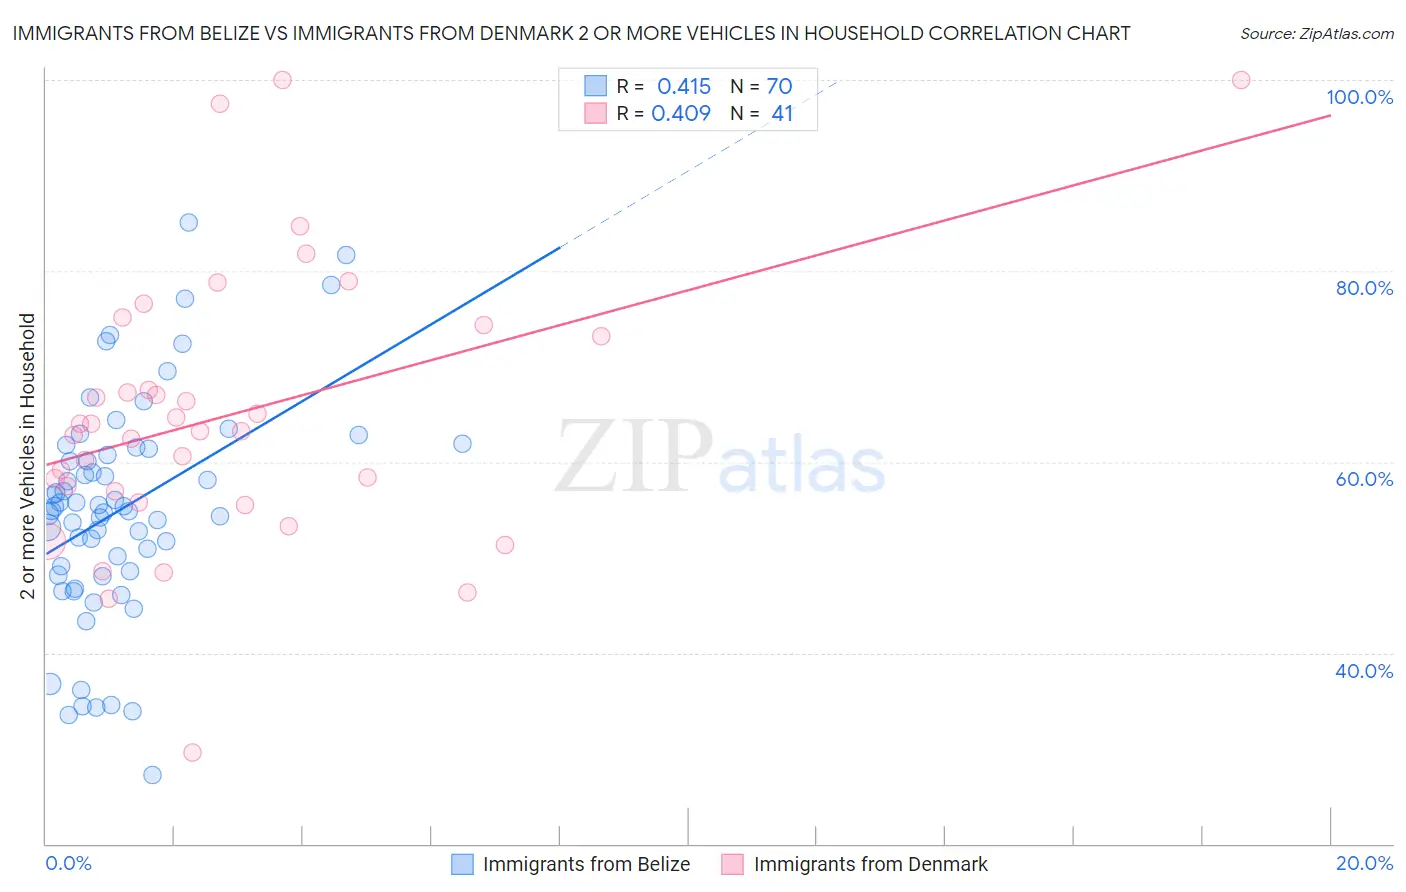
Immigrants from Belize vs Immigrants from Denmark 2 or more Vehicles in Household Correlation Chart
The statistical analysis conducted on geographies consisting of 130,296,303 people shows a moderate positive correlation between the proportion of Immigrants from Belize and percentage of households with 2 or more vehicles available in the United States with a correlation coefficient (R) of 0.415 and weighted average of 49.9%. Similarly, the statistical analysis conducted on geographies consisting of 136,403,254 people shows a moderate positive correlation between the proportion of Immigrants from Denmark and percentage of households with 2 or more vehicles available in the United States with a correlation coefficient (R) of 0.409 and weighted average of 55.3%, a difference of 10.9%.
2 or more Vehicles in Household Correlation Summary
| Measurement | Immigrants from Belize | Immigrants from Denmark |
| Minimum | 27.2% | 29.6% |
| Maximum | 85.1% | 100.0% |
| Range | 57.9% | 70.4% |
| Mean | 55.1% | 64.9% |
| Median | 55.1% | 63.2% |
| Interquartile 25% (IQ1) | 48.6% | 56.3% |
| Interquartile 75% (IQ3) | 61.4% | 73.8% |
| Interquartile Range (IQR) | 12.9% | 17.5% |
| Standard Deviation (Sample) | 11.6% | 14.6% |
| Standard Deviation (Population) | 11.5% | 14.4% |
Similar Demographics by 2 or more Vehicles in Household
Demographics Similar to Immigrants from Belize by 2 or more Vehicles in Household
In terms of 2 or more vehicles in household, the demographic groups most similar to Immigrants from Belize are Tohono O'odham (50.0%, a difference of 0.20%), Immigrants from South America (50.2%, a difference of 0.57%), Immigrants from Greece (50.2%, a difference of 0.63%), Immigrants from Russia (50.3%, a difference of 0.81%), and Immigrants from Morocco (50.3%, a difference of 0.85%).
| Demographics | Rating | Rank | 2 or more Vehicles in Household |
| Immigrants | Spain | 0.0 /100 | #297 | Tragic 50.4% |
| Paraguayans | 0.0 /100 | #298 | Tragic 50.3% |
| Immigrants | Morocco | 0.0 /100 | #299 | Tragic 50.3% |
| Immigrants | Russia | 0.0 /100 | #300 | Tragic 50.3% |
| Immigrants | Greece | 0.0 /100 | #301 | Tragic 50.2% |
| Immigrants | South America | 0.0 /100 | #302 | Tragic 50.2% |
| Tohono O'odham | 0.0 /100 | #303 | Tragic 50.0% |
| Immigrants | Belize | 0.0 /100 | #304 | Tragic 49.9% |
| Immigrants | Western Africa | 0.0 /100 | #305 | Tragic 49.4% |
| Immigrants | Israel | 0.0 /100 | #306 | Tragic 49.2% |
| Hopi | 0.0 /100 | #307 | Tragic 49.0% |
| Albanians | 0.0 /100 | #308 | Tragic 49.0% |
| Moroccans | 0.0 /100 | #309 | Tragic 48.8% |
| Ghanaians | 0.0 /100 | #310 | Tragic 48.0% |
| Immigrants | Belarus | 0.0 /100 | #311 | Tragic 47.9% |
Demographics Similar to Immigrants from Denmark by 2 or more Vehicles in Household
In terms of 2 or more vehicles in household, the demographic groups most similar to Immigrants from Denmark are Navajo (55.3%, a difference of 0.020%), Immigrants from Western Europe (55.4%, a difference of 0.080%), Immigrants from Nicaragua (55.4%, a difference of 0.090%), Immigrants from Cuba (55.3%, a difference of 0.090%), and Menominee (55.3%, a difference of 0.13%).
| Demographics | Rating | Rank | 2 or more Vehicles in Household |
| French American Indians | 56.7 /100 | #168 | Average 55.5% |
| Immigrants | Austria | 56.3 /100 | #169 | Average 55.5% |
| Romanians | 55.8 /100 | #170 | Average 55.5% |
| Immigrants | Costa Rica | 54.4 /100 | #171 | Average 55.4% |
| Immigrants | Nicaragua | 51.6 /100 | #172 | Average 55.4% |
| Immigrants | Western Europe | 51.4 /100 | #173 | Average 55.4% |
| Navajo | 50.0 /100 | #174 | Average 55.3% |
| Immigrants | Denmark | 49.4 /100 | #175 | Average 55.3% |
| Immigrants | Cuba | 47.0 /100 | #176 | Average 55.3% |
| Menominee | 46.2 /100 | #177 | Average 55.3% |
| Immigrants | Sweden | 45.3 /100 | #178 | Average 55.2% |
| Alaskan Athabascans | 42.9 /100 | #179 | Average 55.2% |
| Immigrants | Kenya | 40.4 /100 | #180 | Average 55.1% |
| Immigrants | Micronesia | 38.2 /100 | #181 | Fair 55.1% |
| Cree | 38.2 /100 | #182 | Fair 55.1% |