Immigrants from Kuwait vs Australian 3 or more Vehicles in Household
COMPARE
Immigrants from Kuwait
Australian
3 or more Vehicles in Household
3 or more Vehicles in Household Comparison
Immigrants from Kuwait
Australians
19.1%
3 OR MORE VEHICLES IN HOUSEHOLD
26.1/ 100
METRIC RATING
188th/ 347
METRIC RANK
20.1%
3 OR MORE VEHICLES IN HOUSEHOLD
83.6/ 100
METRIC RATING
146th/ 347
METRIC RANK
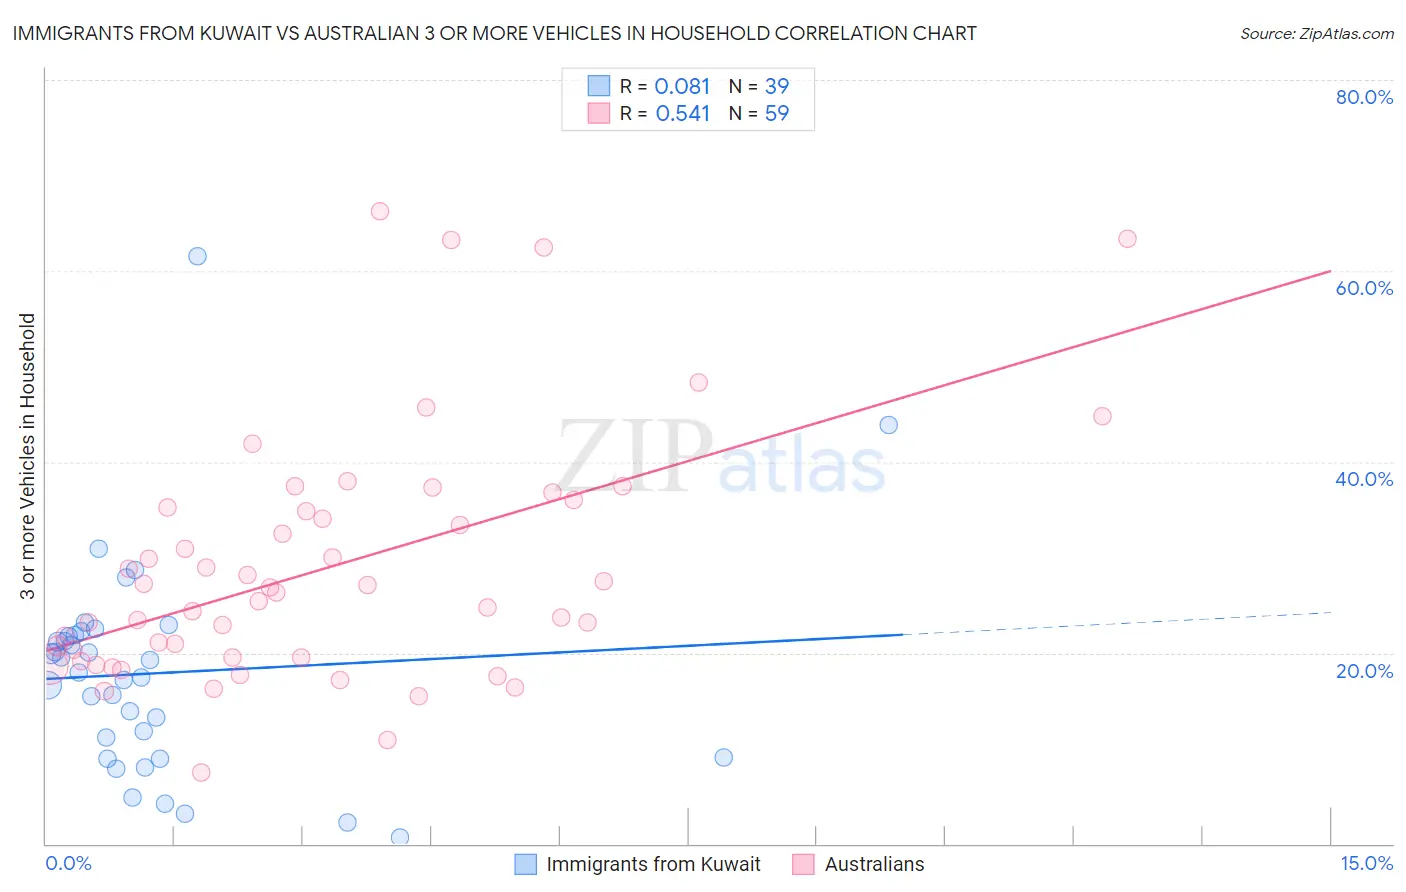
Immigrants from Kuwait vs Australian 3 or more Vehicles in Household Correlation Chart
The statistical analysis conducted on geographies consisting of 136,861,731 people shows a slight positive correlation between the proportion of Immigrants from Kuwait and percentage of households with 3 or more vehicles available in the United States with a correlation coefficient (R) of 0.081 and weighted average of 19.1%. Similarly, the statistical analysis conducted on geographies consisting of 223,939,161 people shows a substantial positive correlation between the proportion of Australians and percentage of households with 3 or more vehicles available in the United States with a correlation coefficient (R) of 0.541 and weighted average of 20.1%, a difference of 5.1%.
3 or more Vehicles in Household Correlation Summary
| Measurement | Immigrants from Kuwait | Australian |
| Minimum | 0.71% | 7.4% |
| Maximum | 61.6% | 66.2% |
| Range | 60.9% | 58.8% |
| Mean | 17.9% | 28.9% |
| Median | 17.9% | 26.3% |
| Interquartile 25% (IQ1) | 9.1% | 19.5% |
| Interquartile 75% (IQ3) | 21.8% | 35.2% |
| Interquartile Range (IQR) | 12.7% | 15.7% |
| Standard Deviation (Sample) | 11.3% | 12.9% |
| Standard Deviation (Population) | 11.1% | 12.8% |
Similar Demographics by 3 or more Vehicles in Household
Demographics Similar to Immigrants from Kuwait by 3 or more Vehicles in Household
In terms of 3 or more vehicles in household, the demographic groups most similar to Immigrants from Kuwait are Indian (Asian) (19.1%, a difference of 0.010%), Immigrants from Zimbabwe (19.1%, a difference of 0.060%), South American Indian (19.1%, a difference of 0.070%), Kenyan (19.1%, a difference of 0.14%), and Tsimshian (19.1%, a difference of 0.17%).
| Demographics | Rating | Rank | 3 or more Vehicles in Household |
| Romanians | 37.1 /100 | #181 | Fair 19.3% |
| Cubans | 36.6 /100 | #182 | Fair 19.3% |
| Cajuns | 36.0 /100 | #183 | Fair 19.3% |
| Latvians | 35.7 /100 | #184 | Fair 19.3% |
| Immigrants | Sri Lanka | 30.7 /100 | #185 | Fair 19.2% |
| Immigrants | Sweden | 29.0 /100 | #186 | Fair 19.2% |
| Immigrants | Hong Kong | 28.3 /100 | #187 | Fair 19.2% |
| Immigrants | Kuwait | 26.1 /100 | #188 | Fair 19.1% |
| Indians (Asian) | 26.0 /100 | #189 | Fair 19.1% |
| Immigrants | Zimbabwe | 25.5 /100 | #190 | Fair 19.1% |
| South American Indians | 25.4 /100 | #191 | Fair 19.1% |
| Kenyans | 24.7 /100 | #192 | Fair 19.1% |
| Tsimshian | 24.4 /100 | #193 | Fair 19.1% |
| Serbians | 24.0 /100 | #194 | Fair 19.1% |
| Immigrants | Moldova | 23.6 /100 | #195 | Fair 19.1% |
Demographics Similar to Australians by 3 or more Vehicles in Household
In terms of 3 or more vehicles in household, the demographic groups most similar to Australians are Palestinian (20.1%, a difference of 0.040%), Iranian (20.1%, a difference of 0.050%), Slovak (20.1%, a difference of 0.080%), Jordanian (20.1%, a difference of 0.11%), and Lithuanian (20.1%, a difference of 0.11%).
| Demographics | Rating | Rank | 3 or more Vehicles in Household |
| Slovenes | 85.5 /100 | #139 | Excellent 20.2% |
| French American Indians | 85.3 /100 | #140 | Excellent 20.1% |
| Ottawa | 84.9 /100 | #141 | Excellent 20.1% |
| Jordanians | 84.4 /100 | #142 | Excellent 20.1% |
| Lithuanians | 84.4 /100 | #143 | Excellent 20.1% |
| Iranians | 84.0 /100 | #144 | Excellent 20.1% |
| Palestinians | 83.9 /100 | #145 | Excellent 20.1% |
| Australians | 83.6 /100 | #146 | Excellent 20.1% |
| Slovaks | 83.0 /100 | #147 | Excellent 20.1% |
| Guatemalans | 82.6 /100 | #148 | Excellent 20.1% |
| Immigrants | Iran | 80.9 /100 | #149 | Excellent 20.0% |
| Immigrants | Immigrants | 80.8 /100 | #150 | Excellent 20.0% |
| Taiwanese | 80.6 /100 | #151 | Excellent 20.0% |
| Lebanese | 79.8 /100 | #152 | Good 20.0% |
| Yuman | 75.6 /100 | #153 | Good 19.9% |