Immigrants from Kuwait vs Croatian 8th Grade
COMPARE
Immigrants from Kuwait
Croatian
8th Grade
8th Grade Comparison
Immigrants from Kuwait
Croatians
96.1%
8TH GRADE
92.2/ 100
METRIC RATING
132nd/ 347
METRIC RANK
97.2%
8TH GRADE
100.0/ 100
METRIC RATING
20th/ 347
METRIC RANK
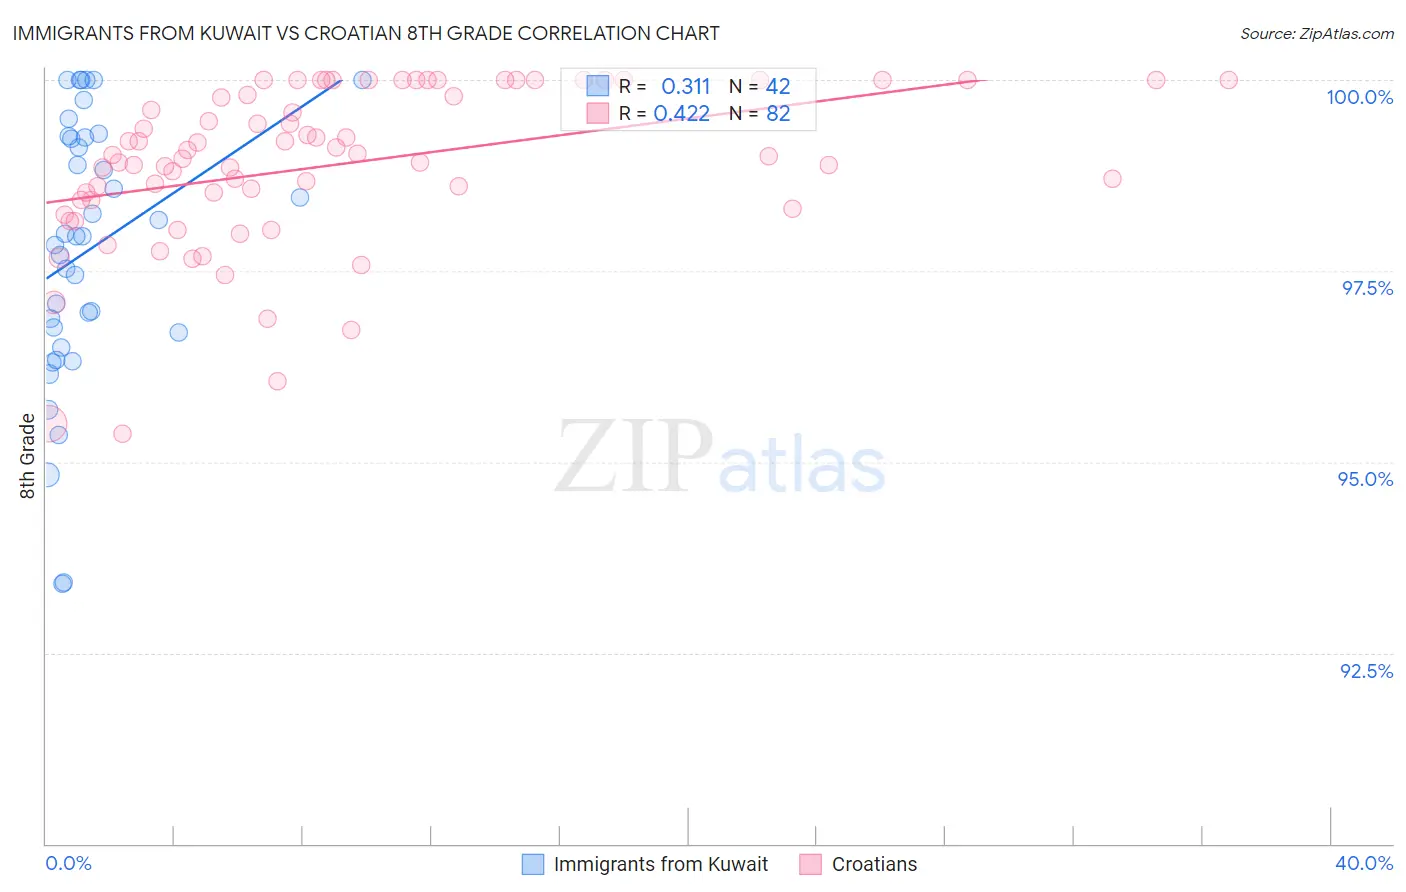
Immigrants from Kuwait vs Croatian 8th Grade Correlation Chart
The statistical analysis conducted on geographies consisting of 136,913,666 people shows a mild positive correlation between the proportion of Immigrants from Kuwait and percentage of population with at least 8th grade education in the United States with a correlation coefficient (R) of 0.311 and weighted average of 96.1%. Similarly, the statistical analysis conducted on geographies consisting of 375,734,226 people shows a moderate positive correlation between the proportion of Croatians and percentage of population with at least 8th grade education in the United States with a correlation coefficient (R) of 0.422 and weighted average of 97.2%, a difference of 1.1%.
8th Grade Correlation Summary
| Measurement | Immigrants from Kuwait | Croatian |
| Minimum | 93.4% | 95.4% |
| Maximum | 100.0% | 100.0% |
| Range | 6.6% | 4.6% |
| Mean | 97.8% | 98.9% |
| Median | 98.0% | 99.0% |
| Interquartile 25% (IQ1) | 96.7% | 98.4% |
| Interquartile 75% (IQ3) | 99.2% | 100.0% |
| Interquartile Range (IQR) | 2.6% | 1.6% |
| Standard Deviation (Sample) | 1.7% | 1.1% |
| Standard Deviation (Population) | 1.7% | 1.1% |
Similar Demographics by 8th Grade
Demographics Similar to Immigrants from Kuwait by 8th Grade
In terms of 8th grade, the demographic groups most similar to Immigrants from Kuwait are Pueblo (96.1%, a difference of 0.0%), Soviet Union (96.1%, a difference of 0.010%), Immigrants from Turkey (96.1%, a difference of 0.010%), Immigrants from Hungary (96.1%, a difference of 0.010%), and Basque (96.1%, a difference of 0.010%).
| Demographics | Rating | Rank | 8th Grade |
| Immigrants | Romania | 94.1 /100 | #125 | Exceptional 96.2% |
| Choctaw | 94.0 /100 | #126 | Exceptional 96.2% |
| Immigrants | Serbia | 94.0 /100 | #127 | Exceptional 96.2% |
| Immigrants | Bosnia and Herzegovina | 93.9 /100 | #128 | Exceptional 96.2% |
| Cheyenne | 93.3 /100 | #129 | Exceptional 96.1% |
| Soviet Union | 92.6 /100 | #130 | Exceptional 96.1% |
| Pueblo | 92.3 /100 | #131 | Exceptional 96.1% |
| Immigrants | Kuwait | 92.2 /100 | #132 | Exceptional 96.1% |
| Immigrants | Turkey | 91.7 /100 | #133 | Exceptional 96.1% |
| Immigrants | Hungary | 91.5 /100 | #134 | Exceptional 96.1% |
| Basques | 91.5 /100 | #135 | Exceptional 96.1% |
| Jordanians | 91.3 /100 | #136 | Exceptional 96.1% |
| Cambodians | 90.6 /100 | #137 | Exceptional 96.1% |
| Burmese | 90.2 /100 | #138 | Exceptional 96.1% |
| Hmong | 89.7 /100 | #139 | Excellent 96.1% |
Demographics Similar to Croatians by 8th Grade
In terms of 8th grade, the demographic groups most similar to Croatians are Danish (97.2%, a difference of 0.020%), Welsh (97.2%, a difference of 0.050%), Scottish (97.3%, a difference of 0.060%), French Canadian (97.2%, a difference of 0.060%), and Scandinavian (97.2%, a difference of 0.060%).
| Demographics | Rating | Rank | 8th Grade |
| Alaskan Athabascans | 100.0 /100 | #13 | Exceptional 97.3% |
| English | 100.0 /100 | #14 | Exceptional 97.3% |
| Pennsylvania Germans | 100.0 /100 | #15 | Exceptional 97.3% |
| Tlingit-Haida | 100.0 /100 | #16 | Exceptional 97.3% |
| Irish | 100.0 /100 | #17 | Exceptional 97.3% |
| Lithuanians | 100.0 /100 | #18 | Exceptional 97.3% |
| Scottish | 100.0 /100 | #19 | Exceptional 97.3% |
| Croatians | 100.0 /100 | #20 | Exceptional 97.2% |
| Danes | 100.0 /100 | #21 | Exceptional 97.2% |
| Welsh | 100.0 /100 | #22 | Exceptional 97.2% |
| French Canadians | 100.0 /100 | #23 | Exceptional 97.2% |
| Scandinavians | 100.0 /100 | #24 | Exceptional 97.2% |
| Czechs | 100.0 /100 | #25 | Exceptional 97.1% |
| French | 100.0 /100 | #26 | Exceptional 97.1% |
| Scotch-Irish | 100.0 /100 | #27 | Exceptional 97.1% |