Immigrants from Indonesia vs Bangladeshi Vision Disability
COMPARE
Immigrants from Indonesia
Bangladeshi
Vision Disability
Vision Disability Comparison
Immigrants from Indonesia
Bangladeshis
2.0%
VISION DISABILITY
99.7/ 100
METRIC RATING
44th/ 347
METRIC RANK
2.3%
VISION DISABILITY
0.5/ 100
METRIC RATING
250th/ 347
METRIC RANK
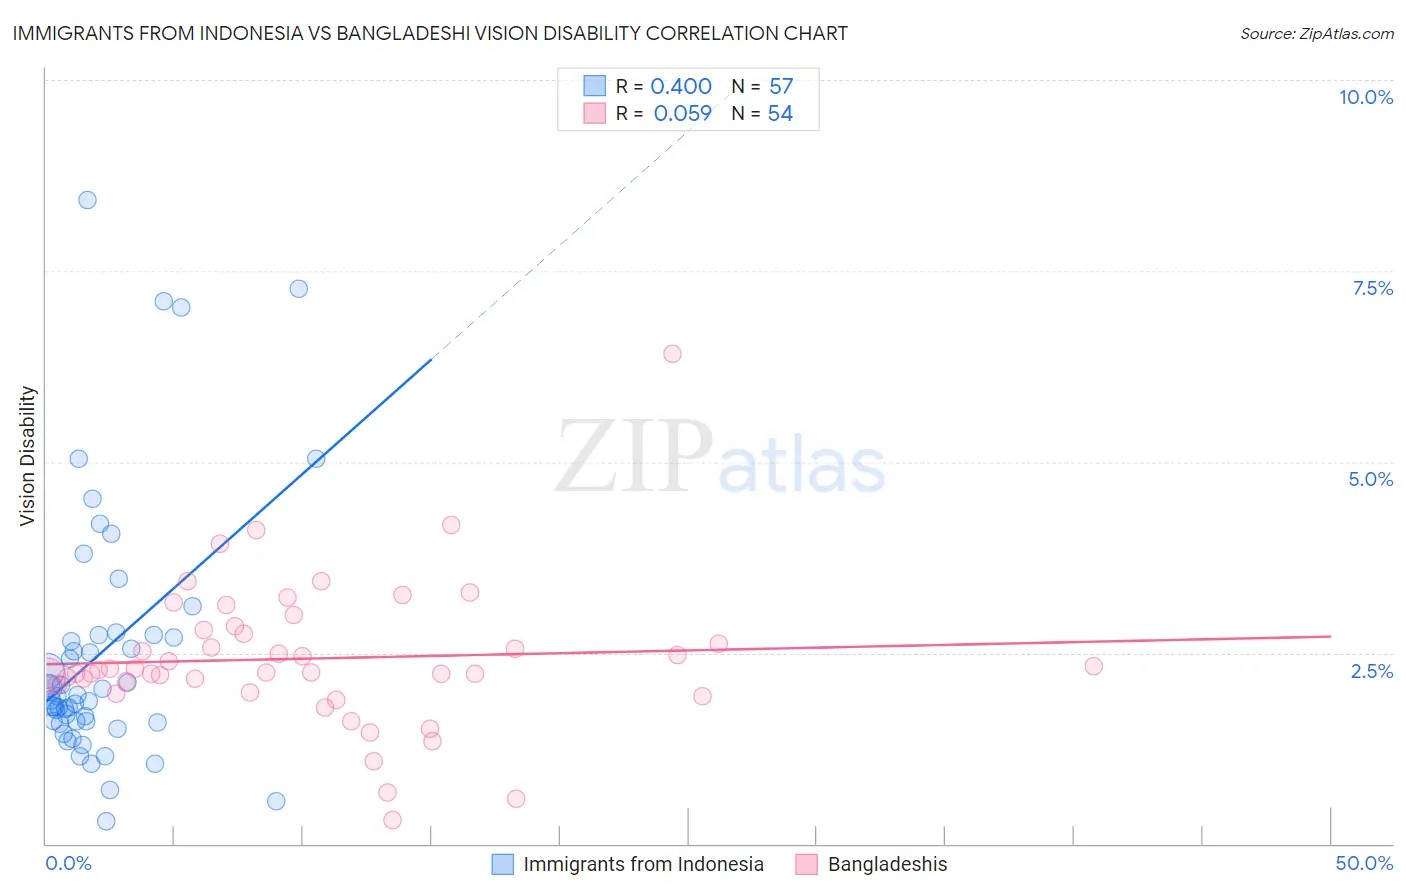
Immigrants from Indonesia vs Bangladeshi Vision Disability Correlation Chart
The statistical analysis conducted on geographies consisting of 215,759,467 people shows a moderate positive correlation between the proportion of Immigrants from Indonesia and percentage of population with vision disability in the United States with a correlation coefficient (R) of 0.400 and weighted average of 2.0%. Similarly, the statistical analysis conducted on geographies consisting of 141,342,048 people shows a slight positive correlation between the proportion of Bangladeshis and percentage of population with vision disability in the United States with a correlation coefficient (R) of 0.059 and weighted average of 2.3%, a difference of 19.2%.
Vision Disability Correlation Summary
| Measurement | Immigrants from Indonesia | Bangladeshi |
| Minimum | 0.29% | 0.30% |
| Maximum | 8.4% | 6.4% |
| Range | 8.1% | 6.1% |
| Mean | 2.5% | 2.4% |
| Median | 1.9% | 2.3% |
| Interquartile 25% (IQ1) | 1.6% | 2.1% |
| Interquartile 75% (IQ3) | 2.7% | 2.8% |
| Interquartile Range (IQR) | 1.1% | 0.72% |
| Standard Deviation (Sample) | 1.7% | 0.96% |
| Standard Deviation (Population) | 1.7% | 0.95% |
Similar Demographics by Vision Disability
Demographics Similar to Immigrants from Indonesia by Vision Disability
In terms of vision disability, the demographic groups most similar to Immigrants from Indonesia are Eastern European (2.0%, a difference of 0.020%), Ethiopian (2.0%, a difference of 0.030%), Immigrants from Sweden (2.0%, a difference of 0.070%), Immigrants from Ethiopia (2.0%, a difference of 0.090%), and Immigrants from Bulgaria (2.0%, a difference of 0.090%).
| Demographics | Rating | Rank | Vision Disability |
| Bhutanese | 99.8 /100 | #37 | Exceptional 2.0% |
| Immigrants | Kuwait | 99.8 /100 | #38 | Exceptional 2.0% |
| Zimbabweans | 99.7 /100 | #39 | Exceptional 2.0% |
| Immigrants | Ireland | 99.7 /100 | #40 | Exceptional 2.0% |
| Cypriots | 99.7 /100 | #41 | Exceptional 2.0% |
| Immigrants | Ethiopia | 99.7 /100 | #42 | Exceptional 2.0% |
| Eastern Europeans | 99.7 /100 | #43 | Exceptional 2.0% |
| Immigrants | Indonesia | 99.7 /100 | #44 | Exceptional 2.0% |
| Ethiopians | 99.7 /100 | #45 | Exceptional 2.0% |
| Immigrants | Sweden | 99.7 /100 | #46 | Exceptional 2.0% |
| Immigrants | Bulgaria | 99.7 /100 | #47 | Exceptional 2.0% |
| Israelis | 99.6 /100 | #48 | Exceptional 2.0% |
| Latvians | 99.5 /100 | #49 | Exceptional 2.0% |
| Afghans | 99.5 /100 | #50 | Exceptional 2.0% |
| Tongans | 99.5 /100 | #51 | Exceptional 2.0% |
Demographics Similar to Bangladeshis by Vision Disability
In terms of vision disability, the demographic groups most similar to Bangladeshis are Liberian (2.3%, a difference of 0.080%), Subsaharan African (2.3%, a difference of 0.10%), Immigrants from Laos (2.4%, a difference of 0.11%), Guatemalan (2.3%, a difference of 0.12%), and French (2.3%, a difference of 0.15%).
| Demographics | Rating | Rank | Vision Disability |
| Immigrants | Nicaragua | 0.6 /100 | #243 | Tragic 2.3% |
| Immigrants | West Indies | 0.6 /100 | #244 | Tragic 2.3% |
| Alsatians | 0.6 /100 | #245 | Tragic 2.3% |
| French | 0.5 /100 | #246 | Tragic 2.3% |
| Guatemalans | 0.5 /100 | #247 | Tragic 2.3% |
| Sub-Saharan Africans | 0.5 /100 | #248 | Tragic 2.3% |
| Liberians | 0.5 /100 | #249 | Tragic 2.3% |
| Bangladeshis | 0.5 /100 | #250 | Tragic 2.3% |
| Immigrants | Laos | 0.4 /100 | #251 | Tragic 2.4% |
| Immigrants | Micronesia | 0.3 /100 | #252 | Tragic 2.4% |
| Japanese | 0.3 /100 | #253 | Tragic 2.4% |
| Haitians | 0.3 /100 | #254 | Tragic 2.4% |
| Immigrants | Guatemala | 0.3 /100 | #255 | Tragic 2.4% |
| Immigrants | Haiti | 0.2 /100 | #256 | Tragic 2.4% |
| West Indians | 0.2 /100 | #257 | Tragic 2.4% |