Immigrants from Indonesia vs Bahamian 3 or more Vehicles in Household
COMPARE
Immigrants from Indonesia
Bahamian
3 or more Vehicles in Household
3 or more Vehicles in Household Comparison
Immigrants from Indonesia
Bahamians
21.1%
3 OR MORE VEHICLES IN HOUSEHOLD
98.8/ 100
METRIC RATING
93rd/ 347
METRIC RANK
16.9%
3 OR MORE VEHICLES IN HOUSEHOLD
0.1/ 100
METRIC RATING
293rd/ 347
METRIC RANK
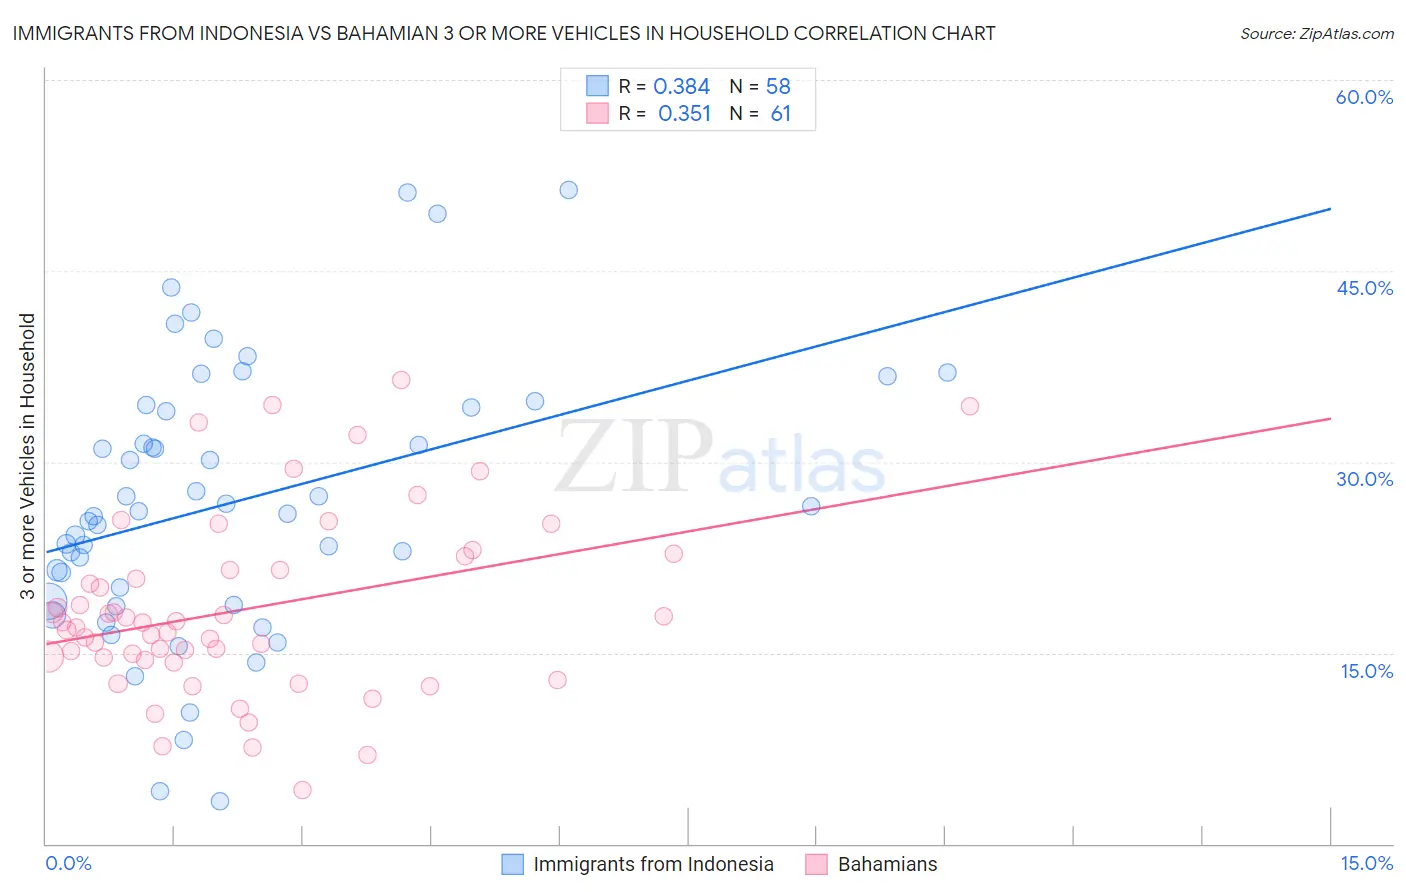
Immigrants from Indonesia vs Bahamian 3 or more Vehicles in Household Correlation Chart
The statistical analysis conducted on geographies consisting of 215,673,146 people shows a mild positive correlation between the proportion of Immigrants from Indonesia and percentage of households with 3 or more vehicles available in the United States with a correlation coefficient (R) of 0.384 and weighted average of 21.1%. Similarly, the statistical analysis conducted on geographies consisting of 112,623,128 people shows a mild positive correlation between the proportion of Bahamians and percentage of households with 3 or more vehicles available in the United States with a correlation coefficient (R) of 0.351 and weighted average of 16.9%, a difference of 24.6%.
3 or more Vehicles in Household Correlation Summary
| Measurement | Immigrants from Indonesia | Bahamian |
| Minimum | 3.3% | 4.2% |
| Maximum | 51.4% | 36.4% |
| Range | 48.1% | 32.2% |
| Mean | 26.9% | 18.4% |
| Median | 26.0% | 17.4% |
| Interquartile 25% (IQ1) | 19.0% | 14.5% |
| Interquartile 75% (IQ3) | 34.3% | 22.1% |
| Interquartile Range (IQR) | 15.3% | 7.5% |
| Standard Deviation (Sample) | 10.7% | 7.1% |
| Standard Deviation (Population) | 10.6% | 7.0% |
Similar Demographics by 3 or more Vehicles in Household
Demographics Similar to Immigrants from Indonesia by 3 or more Vehicles in Household
In terms of 3 or more vehicles in household, the demographic groups most similar to Immigrants from Indonesia are Apache (21.2%, a difference of 0.20%), Immigrants from Cambodia (21.1%, a difference of 0.23%), Belgian (21.2%, a difference of 0.28%), Pakistani (21.0%, a difference of 0.37%), and Cree (21.0%, a difference of 0.46%).
| Demographics | Rating | Rank | 3 or more Vehicles in Household |
| Delaware | 99.6 /100 | #86 | Exceptional 21.5% |
| Immigrants | Azores | 99.5 /100 | #87 | Exceptional 21.5% |
| French | 99.4 /100 | #88 | Exceptional 21.4% |
| Marshallese | 99.2 /100 | #89 | Exceptional 21.3% |
| Immigrants | Afghanistan | 99.1 /100 | #90 | Exceptional 21.2% |
| Belgians | 98.9 /100 | #91 | Exceptional 21.2% |
| Apache | 98.9 /100 | #92 | Exceptional 21.2% |
| Immigrants | Indonesia | 98.8 /100 | #93 | Exceptional 21.1% |
| Immigrants | Cambodia | 98.6 /100 | #94 | Exceptional 21.1% |
| Pakistanis | 98.5 /100 | #95 | Exceptional 21.0% |
| Cree | 98.4 /100 | #96 | Exceptional 21.0% |
| Canadians | 98.3 /100 | #97 | Exceptional 21.0% |
| Hmong | 98.2 /100 | #98 | Exceptional 21.0% |
| Alaska Natives | 98.2 /100 | #99 | Exceptional 21.0% |
| Comanche | 98.2 /100 | #100 | Exceptional 21.0% |
Demographics Similar to Bahamians by 3 or more Vehicles in Household
In terms of 3 or more vehicles in household, the demographic groups most similar to Bahamians are Immigrants from Spain (17.0%, a difference of 0.080%), Immigrants from Western Africa (16.9%, a difference of 0.11%), Immigrants from Russia (16.9%, a difference of 0.16%), Immigrants from Congo (17.0%, a difference of 0.20%), and Liberian (17.0%, a difference of 0.35%).
| Demographics | Rating | Rank | 3 or more Vehicles in Household |
| Menominee | 0.2 /100 | #286 | Tragic 17.2% |
| Immigrants | Brazil | 0.2 /100 | #287 | Tragic 17.1% |
| Immigrants | Uruguay | 0.2 /100 | #288 | Tragic 17.1% |
| Immigrants | Liberia | 0.1 /100 | #289 | Tragic 17.1% |
| Liberians | 0.1 /100 | #290 | Tragic 17.0% |
| Immigrants | Congo | 0.1 /100 | #291 | Tragic 17.0% |
| Immigrants | Spain | 0.1 /100 | #292 | Tragic 17.0% |
| Bahamians | 0.1 /100 | #293 | Tragic 16.9% |
| Immigrants | Western Africa | 0.1 /100 | #294 | Tragic 16.9% |
| Immigrants | Russia | 0.1 /100 | #295 | Tragic 16.9% |
| Inupiat | 0.1 /100 | #296 | Tragic 16.9% |
| Israelis | 0.1 /100 | #297 | Tragic 16.8% |
| Immigrants | Zaire | 0.1 /100 | #298 | Tragic 16.7% |
| Immigrants | South America | 0.1 /100 | #299 | Tragic 16.7% |
| Cypriots | 0.0 /100 | #300 | Tragic 16.6% |