Cambodian vs Maltese 3 or more Vehicles in Household
COMPARE
Cambodian
Maltese
3 or more Vehicles in Household
3 or more Vehicles in Household Comparison
Cambodians
Maltese
17.8%
3 OR MORE VEHICLES IN HOUSEHOLD
0.9/ 100
METRIC RATING
264th/ 347
METRIC RANK
20.5%
3 OR MORE VEHICLES IN HOUSEHOLD
93.9/ 100
METRIC RATING
120th/ 347
METRIC RANK
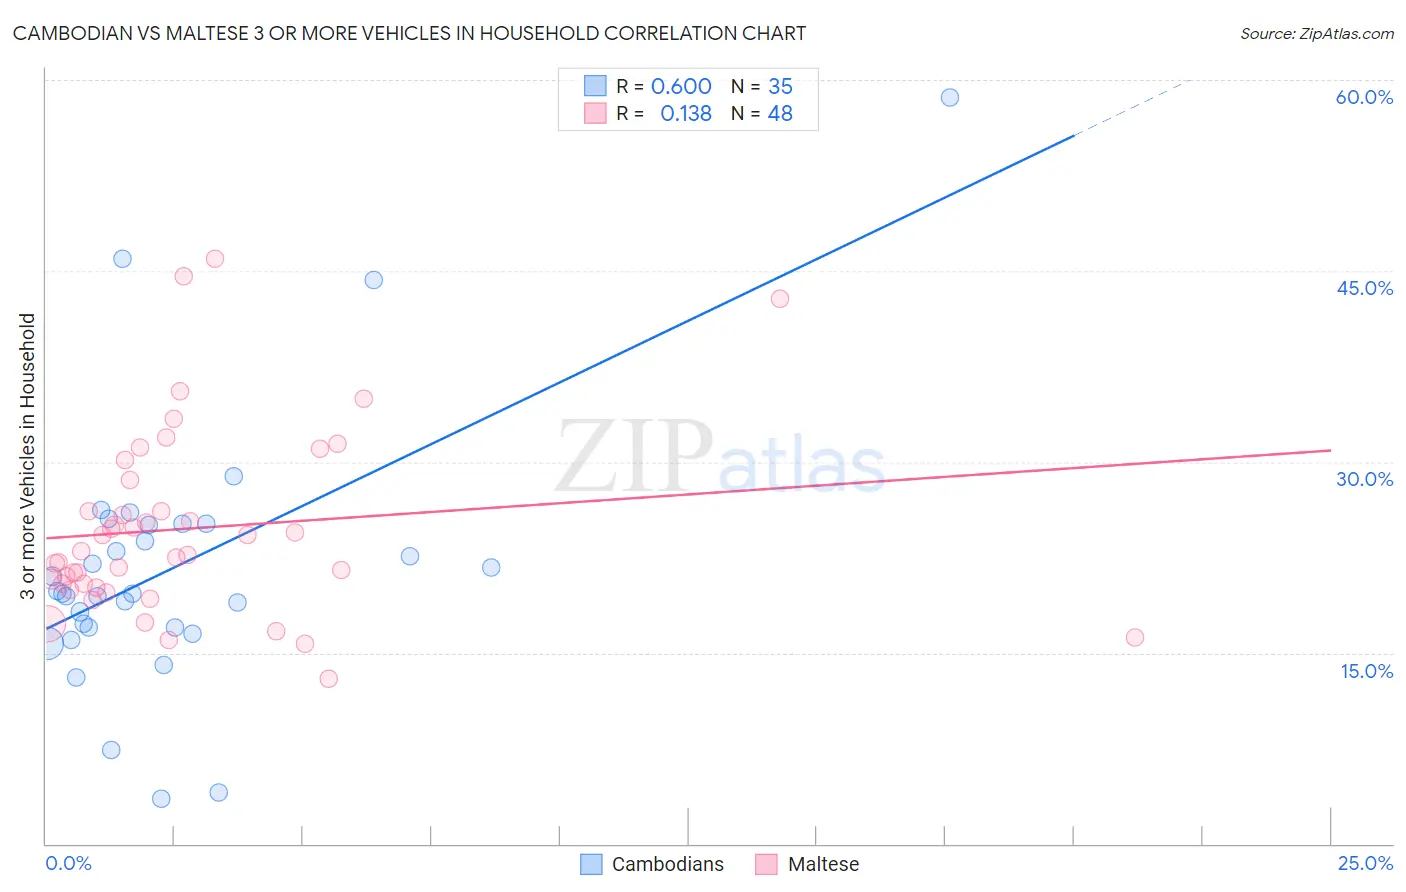
Cambodian vs Maltese 3 or more Vehicles in Household Correlation Chart
The statistical analysis conducted on geographies consisting of 102,461,306 people shows a significant positive correlation between the proportion of Cambodians and percentage of households with 3 or more vehicles available in the United States with a correlation coefficient (R) of 0.600 and weighted average of 17.8%. Similarly, the statistical analysis conducted on geographies consisting of 126,427,013 people shows a poor positive correlation between the proportion of Maltese and percentage of households with 3 or more vehicles available in the United States with a correlation coefficient (R) of 0.138 and weighted average of 20.5%, a difference of 15.5%.
3 or more Vehicles in Household Correlation Summary
| Measurement | Cambodian | Maltese |
| Minimum | 3.5% | 12.9% |
| Maximum | 58.6% | 45.9% |
| Range | 55.1% | 33.0% |
| Mean | 21.7% | 24.8% |
| Median | 19.7% | 22.8% |
| Interquartile 25% (IQ1) | 17.0% | 20.2% |
| Interquartile 75% (IQ3) | 25.1% | 27.4% |
| Interquartile Range (IQR) | 8.1% | 7.1% |
| Standard Deviation (Sample) | 10.6% | 7.3% |
| Standard Deviation (Population) | 10.4% | 7.2% |
Similar Demographics by 3 or more Vehicles in Household
Demographics Similar to Cambodians by 3 or more Vehicles in Household
In terms of 3 or more vehicles in household, the demographic groups most similar to Cambodians are Bermudan (17.8%, a difference of 0.030%), Colombian (17.8%, a difference of 0.14%), Immigrants from Panama (17.7%, a difference of 0.14%), Immigrants from Northern Africa (17.8%, a difference of 0.16%), and Macedonian (17.7%, a difference of 0.16%).
| Demographics | Rating | Rank | 3 or more Vehicles in Household |
| Immigrants | Eritrea | 1.1 /100 | #257 | Tragic 17.8% |
| Sudanese | 1.1 /100 | #258 | Tragic 17.8% |
| Uruguayans | 1.0 /100 | #259 | Tragic 17.8% |
| Ugandans | 0.9 /100 | #260 | Tragic 17.8% |
| Immigrants | Northern Africa | 0.9 /100 | #261 | Tragic 17.8% |
| Colombians | 0.9 /100 | #262 | Tragic 17.8% |
| Bermudans | 0.9 /100 | #263 | Tragic 17.8% |
| Cambodians | 0.9 /100 | #264 | Tragic 17.8% |
| Immigrants | Panama | 0.8 /100 | #265 | Tragic 17.7% |
| Macedonians | 0.8 /100 | #266 | Tragic 17.7% |
| Immigrants | Venezuela | 0.8 /100 | #267 | Tragic 17.7% |
| Immigrants | Bulgaria | 0.8 /100 | #268 | Tragic 17.7% |
| Immigrants | France | 0.6 /100 | #269 | Tragic 17.6% |
| Immigrants | Nepal | 0.6 /100 | #270 | Tragic 17.6% |
| South Americans | 0.6 /100 | #271 | Tragic 17.6% |
Demographics Similar to Maltese by 3 or more Vehicles in Household
In terms of 3 or more vehicles in household, the demographic groups most similar to Maltese are Immigrants from Thailand (20.5%, a difference of 0.010%), German Russian (20.5%, a difference of 0.060%), Immigrants from Korea (20.5%, a difference of 0.060%), Immigrants from Latin America (20.5%, a difference of 0.19%), and Costa Rican (20.6%, a difference of 0.23%).
| Demographics | Rating | Rank | 3 or more Vehicles in Household |
| Immigrants | England | 96.2 /100 | #113 | Exceptional 20.7% |
| Burmese | 95.8 /100 | #114 | Exceptional 20.6% |
| French Canadians | 95.0 /100 | #115 | Exceptional 20.6% |
| Italians | 94.9 /100 | #116 | Exceptional 20.6% |
| Croatians | 94.9 /100 | #117 | Exceptional 20.6% |
| Costa Ricans | 94.6 /100 | #118 | Exceptional 20.6% |
| Immigrants | Latin America | 94.5 /100 | #119 | Exceptional 20.5% |
| Maltese | 93.9 /100 | #120 | Exceptional 20.5% |
| Immigrants | Thailand | 93.8 /100 | #121 | Exceptional 20.5% |
| German Russians | 93.7 /100 | #122 | Exceptional 20.5% |
| Immigrants | Korea | 93.7 /100 | #123 | Exceptional 20.5% |
| Central Americans | 93.1 /100 | #124 | Exceptional 20.5% |
| Immigrants | Netherlands | 92.9 /100 | #125 | Exceptional 20.4% |
| Slavs | 92.1 /100 | #126 | Exceptional 20.4% |
| Immigrants | Bolivia | 92.0 /100 | #127 | Exceptional 20.4% |