Immigrants from Ecuador vs Native/Alaskan 3 or more Vehicles in Household
COMPARE
Immigrants from Ecuador
Native/Alaskan
3 or more Vehicles in Household
3 or more Vehicles in Household Comparison
Immigrants from Ecuador
Natives/Alaskans
13.4%
3 OR MORE VEHICLES IN HOUSEHOLD
0.0/ 100
METRIC RATING
334th/ 347
METRIC RANK
22.7%
3 OR MORE VEHICLES IN HOUSEHOLD
100.0/ 100
METRIC RATING
42nd/ 347
METRIC RANK
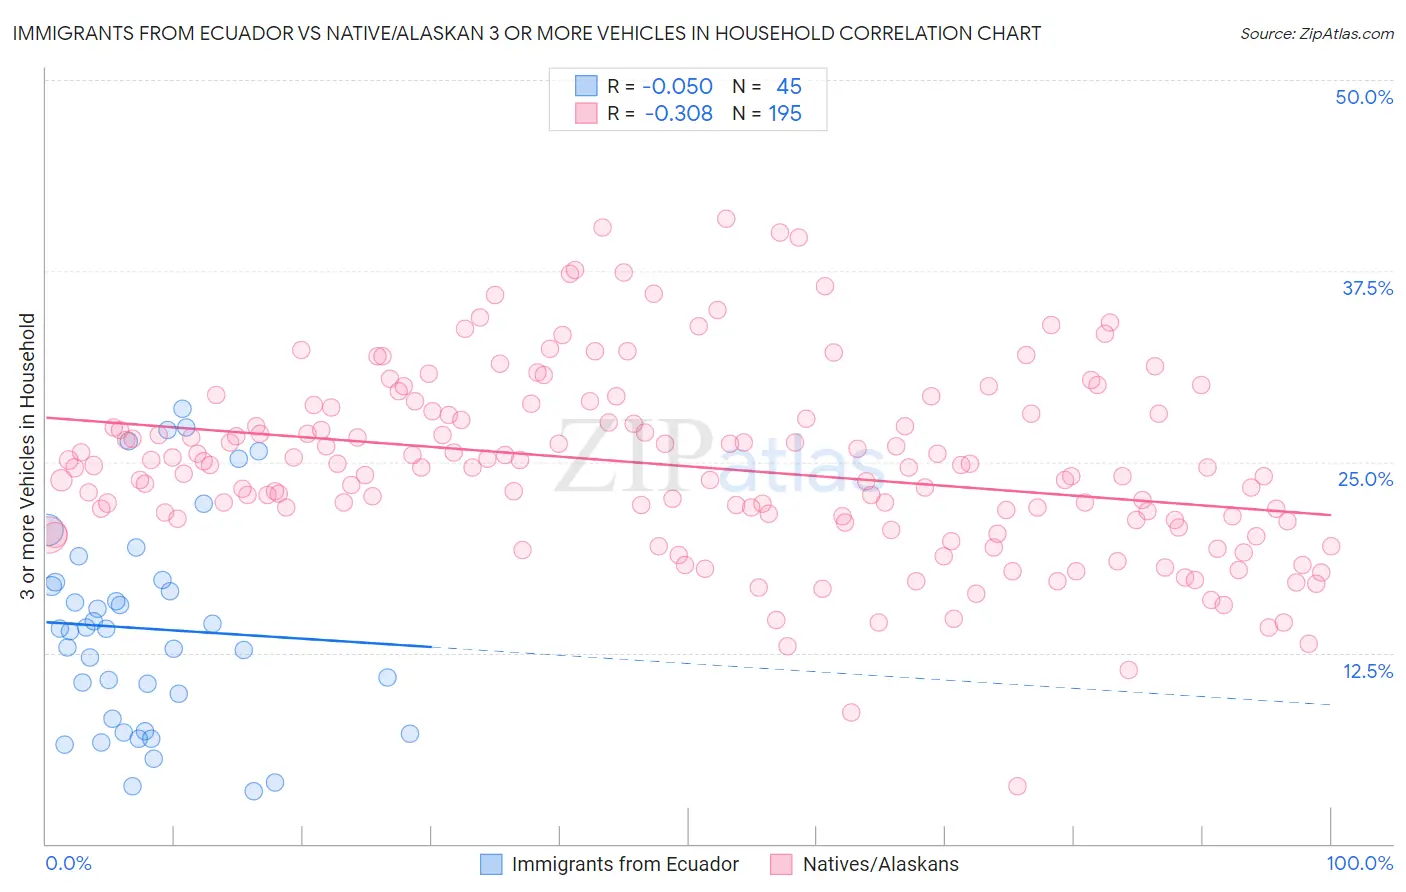
Immigrants from Ecuador vs Native/Alaskan 3 or more Vehicles in Household Correlation Chart
The statistical analysis conducted on geographies consisting of 270,830,512 people shows a slight negative correlation between the proportion of Immigrants from Ecuador and percentage of households with 3 or more vehicles available in the United States with a correlation coefficient (R) of -0.050 and weighted average of 13.4%. Similarly, the statistical analysis conducted on geographies consisting of 512,441,086 people shows a mild negative correlation between the proportion of Natives/Alaskans and percentage of households with 3 or more vehicles available in the United States with a correlation coefficient (R) of -0.308 and weighted average of 22.7%, a difference of 69.7%.
3 or more Vehicles in Household Correlation Summary
| Measurement | Immigrants from Ecuador | Native/Alaskan |
| Minimum | 3.4% | 3.7% |
| Maximum | 28.5% | 40.9% |
| Range | 25.0% | 37.2% |
| Mean | 14.1% | 24.7% |
| Median | 14.1% | 24.6% |
| Interquartile 25% (IQ1) | 7.8% | 21.2% |
| Interquartile 75% (IQ3) | 17.2% | 28.1% |
| Interquartile Range (IQR) | 9.4% | 6.9% |
| Standard Deviation (Sample) | 6.8% | 6.0% |
| Standard Deviation (Population) | 6.7% | 6.0% |
Similar Demographics by 3 or more Vehicles in Household
Demographics Similar to Immigrants from Ecuador by 3 or more Vehicles in Household
In terms of 3 or more vehicles in household, the demographic groups most similar to Immigrants from Ecuador are Immigrants from Trinidad and Tobago (13.3%, a difference of 0.46%), Immigrants from Cabo Verde (13.6%, a difference of 1.3%), Trinidadian and Tobagonian (13.6%, a difference of 1.6%), Immigrants from Dominica (13.7%, a difference of 2.4%), and West Indian (13.7%, a difference of 2.6%).
| Demographics | Rating | Rank | 3 or more Vehicles in Household |
| Ecuadorians | 0.0 /100 | #327 | Tragic 14.1% |
| Immigrants | Albania | 0.0 /100 | #328 | Tragic 14.0% |
| Immigrants | Senegal | 0.0 /100 | #329 | Tragic 13.8% |
| West Indians | 0.0 /100 | #330 | Tragic 13.7% |
| Immigrants | Dominica | 0.0 /100 | #331 | Tragic 13.7% |
| Trinidadians and Tobagonians | 0.0 /100 | #332 | Tragic 13.6% |
| Immigrants | Cabo Verde | 0.0 /100 | #333 | Tragic 13.6% |
| Immigrants | Ecuador | 0.0 /100 | #334 | Tragic 13.4% |
| Immigrants | Trinidad and Tobago | 0.0 /100 | #335 | Tragic 13.3% |
| Barbadians | 0.0 /100 | #336 | Tragic 12.6% |
| Immigrants | Bangladesh | 0.0 /100 | #337 | Tragic 12.5% |
| Vietnamese | 0.0 /100 | #338 | Tragic 12.5% |
| Immigrants | Uzbekistan | 0.0 /100 | #339 | Tragic 12.0% |
| Immigrants | Barbados | 0.0 /100 | #340 | Tragic 11.7% |
| Guyanese | 0.0 /100 | #341 | Tragic 11.5% |
Demographics Similar to Natives/Alaskans by 3 or more Vehicles in Household
In terms of 3 or more vehicles in household, the demographic groups most similar to Natives/Alaskans are German (22.7%, a difference of 0.0%), Osage (22.7%, a difference of 0.11%), Cheyenne (22.7%, a difference of 0.25%), Ute (22.7%, a difference of 0.35%), and European (22.9%, a difference of 0.47%).
| Demographics | Rating | Rank | 3 or more Vehicles in Household |
| Choctaw | 100.0 /100 | #35 | Exceptional 23.0% |
| Cherokee | 100.0 /100 | #36 | Exceptional 23.0% |
| Swedes | 100.0 /100 | #37 | Exceptional 23.0% |
| Dutch | 100.0 /100 | #38 | Exceptional 22.9% |
| Yaqui | 100.0 /100 | #39 | Exceptional 22.9% |
| Europeans | 100.0 /100 | #40 | Exceptional 22.9% |
| Germans | 100.0 /100 | #41 | Exceptional 22.7% |
| Natives/Alaskans | 100.0 /100 | #42 | Exceptional 22.7% |
| Osage | 100.0 /100 | #43 | Exceptional 22.7% |
| Cheyenne | 100.0 /100 | #44 | Exceptional 22.7% |
| Ute | 100.0 /100 | #45 | Exceptional 22.7% |
| Americans | 100.0 /100 | #46 | Exceptional 22.6% |
| Malaysians | 100.0 /100 | #47 | Exceptional 22.6% |
| Scottish | 100.0 /100 | #48 | Exceptional 22.6% |
| Scotch-Irish | 100.0 /100 | #49 | Exceptional 22.6% |