Immigrants from Ecuador vs Native/Alaskan Unemployment Among Women with Children Under 6 years
COMPARE
Immigrants from Ecuador
Native/Alaskan
Unemployment Among Women with Children Under 6 years
Unemployment Among Women with Children Under 6 years Comparison
Immigrants from Ecuador
Natives/Alaskans
7.9%
UNEMPLOYMENT AMONG WOMEN WITH CHILDREN UNDER 6 YEARS
14.9/ 100
METRIC RATING
211th/ 347
METRIC RANK
11.5%
UNEMPLOYMENT AMONG WOMEN WITH CHILDREN UNDER 6 YEARS
0.0/ 100
METRIC RATING
333rd/ 347
METRIC RANK
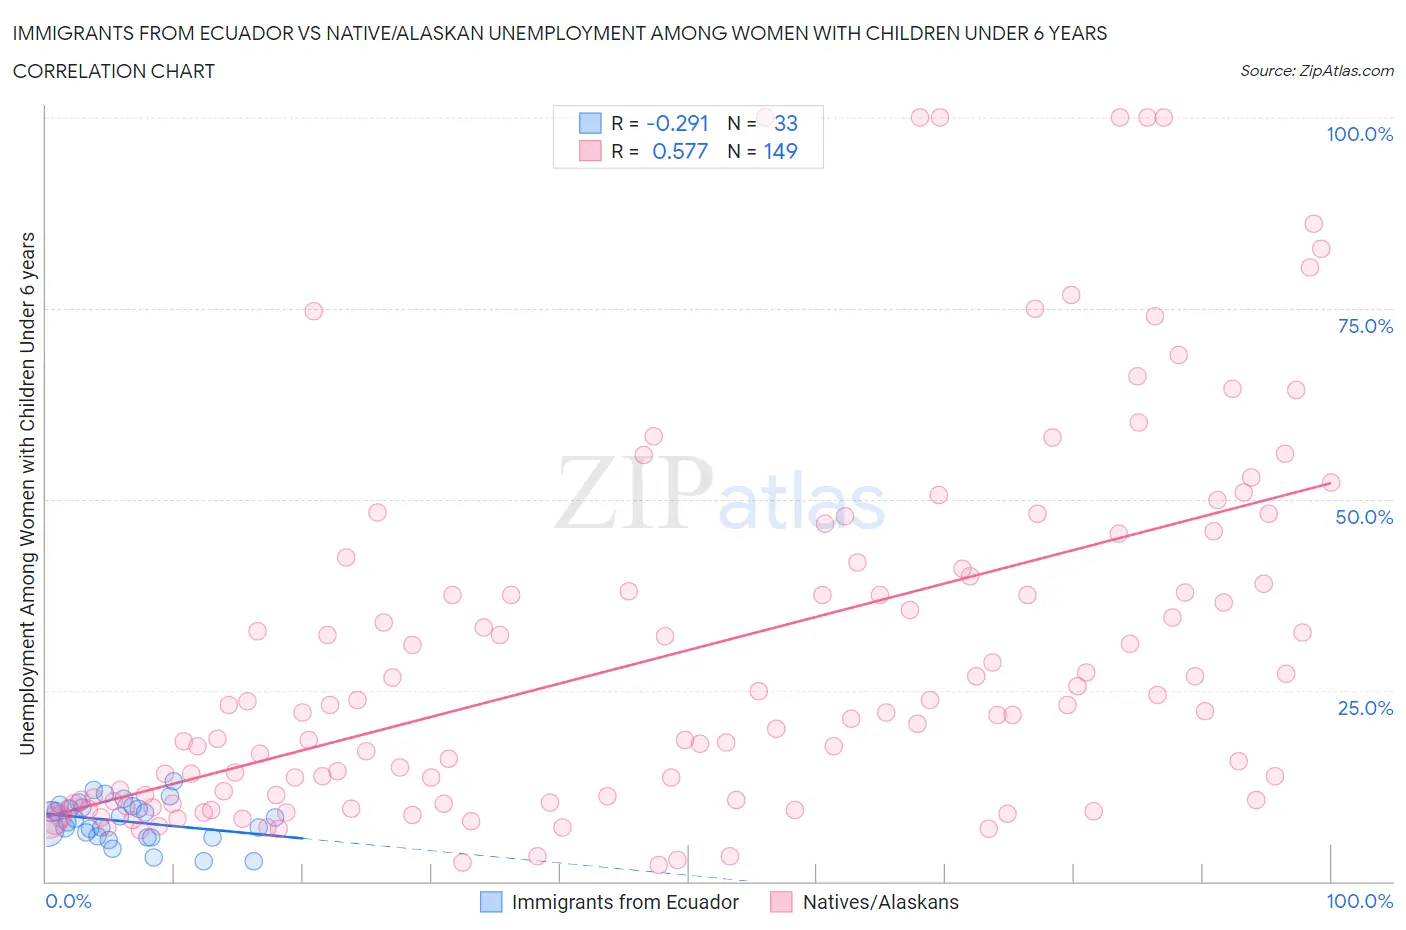
Immigrants from Ecuador vs Native/Alaskan Unemployment Among Women with Children Under 6 years Correlation Chart
The statistical analysis conducted on geographies consisting of 223,112,297 people shows a weak negative correlation between the proportion of Immigrants from Ecuador and unemployment rate among women with children under the age of 6 in the United States with a correlation coefficient (R) of -0.291 and weighted average of 7.9%. Similarly, the statistical analysis conducted on geographies consisting of 362,805,436 people shows a substantial positive correlation between the proportion of Natives/Alaskans and unemployment rate among women with children under the age of 6 in the United States with a correlation coefficient (R) of 0.577 and weighted average of 11.5%, a difference of 46.5%.
Unemployment Among Women with Children Under 6 years Correlation Summary
| Measurement | Immigrants from Ecuador | Native/Alaskan |
| Minimum | 2.6% | 2.2% |
| Maximum | 13.0% | 100.0% |
| Range | 10.4% | 97.8% |
| Mean | 7.8% | 29.8% |
| Median | 8.2% | 22.1% |
| Interquartile 25% (IQ1) | 5.8% | 10.5% |
| Interquartile 75% (IQ3) | 9.7% | 40.5% |
| Interquartile Range (IQR) | 3.9% | 29.9% |
| Standard Deviation (Sample) | 2.6% | 24.3% |
| Standard Deviation (Population) | 2.6% | 24.2% |
Similar Demographics by Unemployment Among Women with Children Under 6 years
Demographics Similar to Immigrants from Ecuador by Unemployment Among Women with Children Under 6 years
In terms of unemployment among women with children under 6 years, the demographic groups most similar to Immigrants from Ecuador are Polish (7.9%, a difference of 0.13%), Costa Rican (7.8%, a difference of 0.31%), Swiss (7.9%, a difference of 0.37%), Immigrants from Syria (7.8%, a difference of 0.45%), and Scottish (7.9%, a difference of 0.50%).
| Demographics | Rating | Rank | Unemployment Among Women with Children Under 6 years |
| Lebanese | 22.2 /100 | #204 | Fair 7.8% |
| Immigrants | Immigrants | 21.4 /100 | #205 | Fair 7.8% |
| Hungarians | 21.2 /100 | #206 | Fair 7.8% |
| Canadians | 20.6 /100 | #207 | Fair 7.8% |
| Immigrants | Syria | 18.9 /100 | #208 | Poor 7.8% |
| Costa Ricans | 17.6 /100 | #209 | Poor 7.8% |
| Poles | 16.0 /100 | #210 | Poor 7.9% |
| Immigrants | Ecuador | 14.9 /100 | #211 | Poor 7.9% |
| Swiss | 12.3 /100 | #212 | Poor 7.9% |
| Scottish | 11.4 /100 | #213 | Poor 7.9% |
| Spanish | 11.3 /100 | #214 | Poor 7.9% |
| Ecuadorians | 11.2 /100 | #215 | Poor 7.9% |
| Immigrants | Lebanon | 11.1 /100 | #216 | Poor 7.9% |
| Immigrants | Nigeria | 10.3 /100 | #217 | Poor 7.9% |
| Moroccans | 9.7 /100 | #218 | Tragic 7.9% |
Demographics Similar to Natives/Alaskans by Unemployment Among Women with Children Under 6 years
In terms of unemployment among women with children under 6 years, the demographic groups most similar to Natives/Alaskans are Sioux (11.5%, a difference of 0.56%), Colville (11.2%, a difference of 3.3%), Apache (12.3%, a difference of 6.9%), Pennsylvania German (10.8%, a difference of 7.0%), and Puerto Rican (12.5%, a difference of 8.8%).
| Demographics | Rating | Rank | Unemployment Among Women with Children Under 6 years |
| Delaware | 0.0 /100 | #326 | Tragic 9.8% |
| Ottawa | 0.0 /100 | #327 | Tragic 9.9% |
| Tohono O'odham | 0.0 /100 | #328 | Tragic 10.2% |
| Blacks/African Americans | 0.0 /100 | #329 | Tragic 10.3% |
| Pennsylvania Germans | 0.0 /100 | #330 | Tragic 10.8% |
| Colville | 0.0 /100 | #331 | Tragic 11.2% |
| Sioux | 0.0 /100 | #332 | Tragic 11.5% |
| Natives/Alaskans | 0.0 /100 | #333 | Tragic 11.5% |
| Apache | 0.0 /100 | #334 | Tragic 12.3% |
| Puerto Ricans | 0.0 /100 | #335 | Tragic 12.5% |
| Shoshone | 0.0 /100 | #336 | Tragic 13.2% |
| Chippewa | 0.0 /100 | #337 | Tragic 13.3% |
| Pima | 0.0 /100 | #338 | Tragic 13.4% |
| Navajo | 0.0 /100 | #339 | Tragic 13.5% |
| Immigrants | Yemen | 0.0 /100 | #340 | Tragic 13.5% |